Useful Data
A comprehensive repository of empirical data, statistical benchmarks, and testing records for Stockfish.
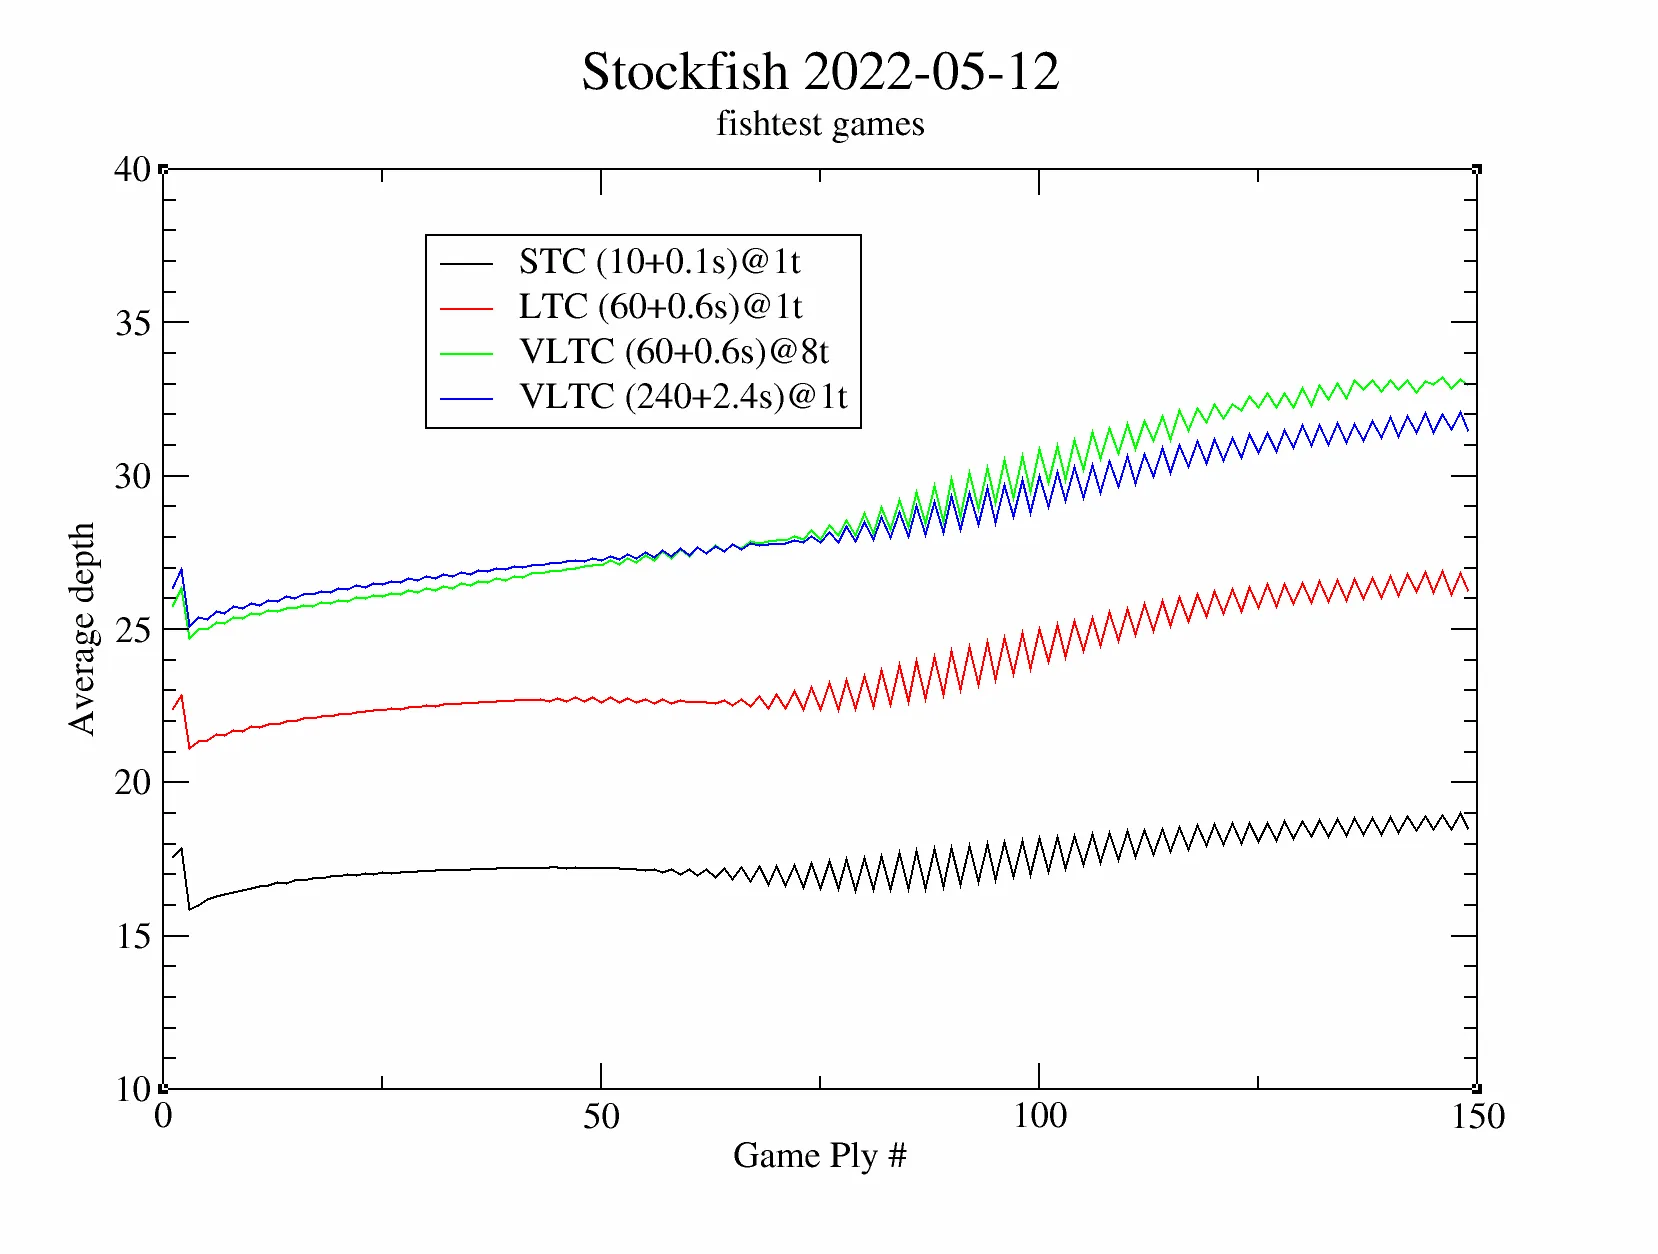
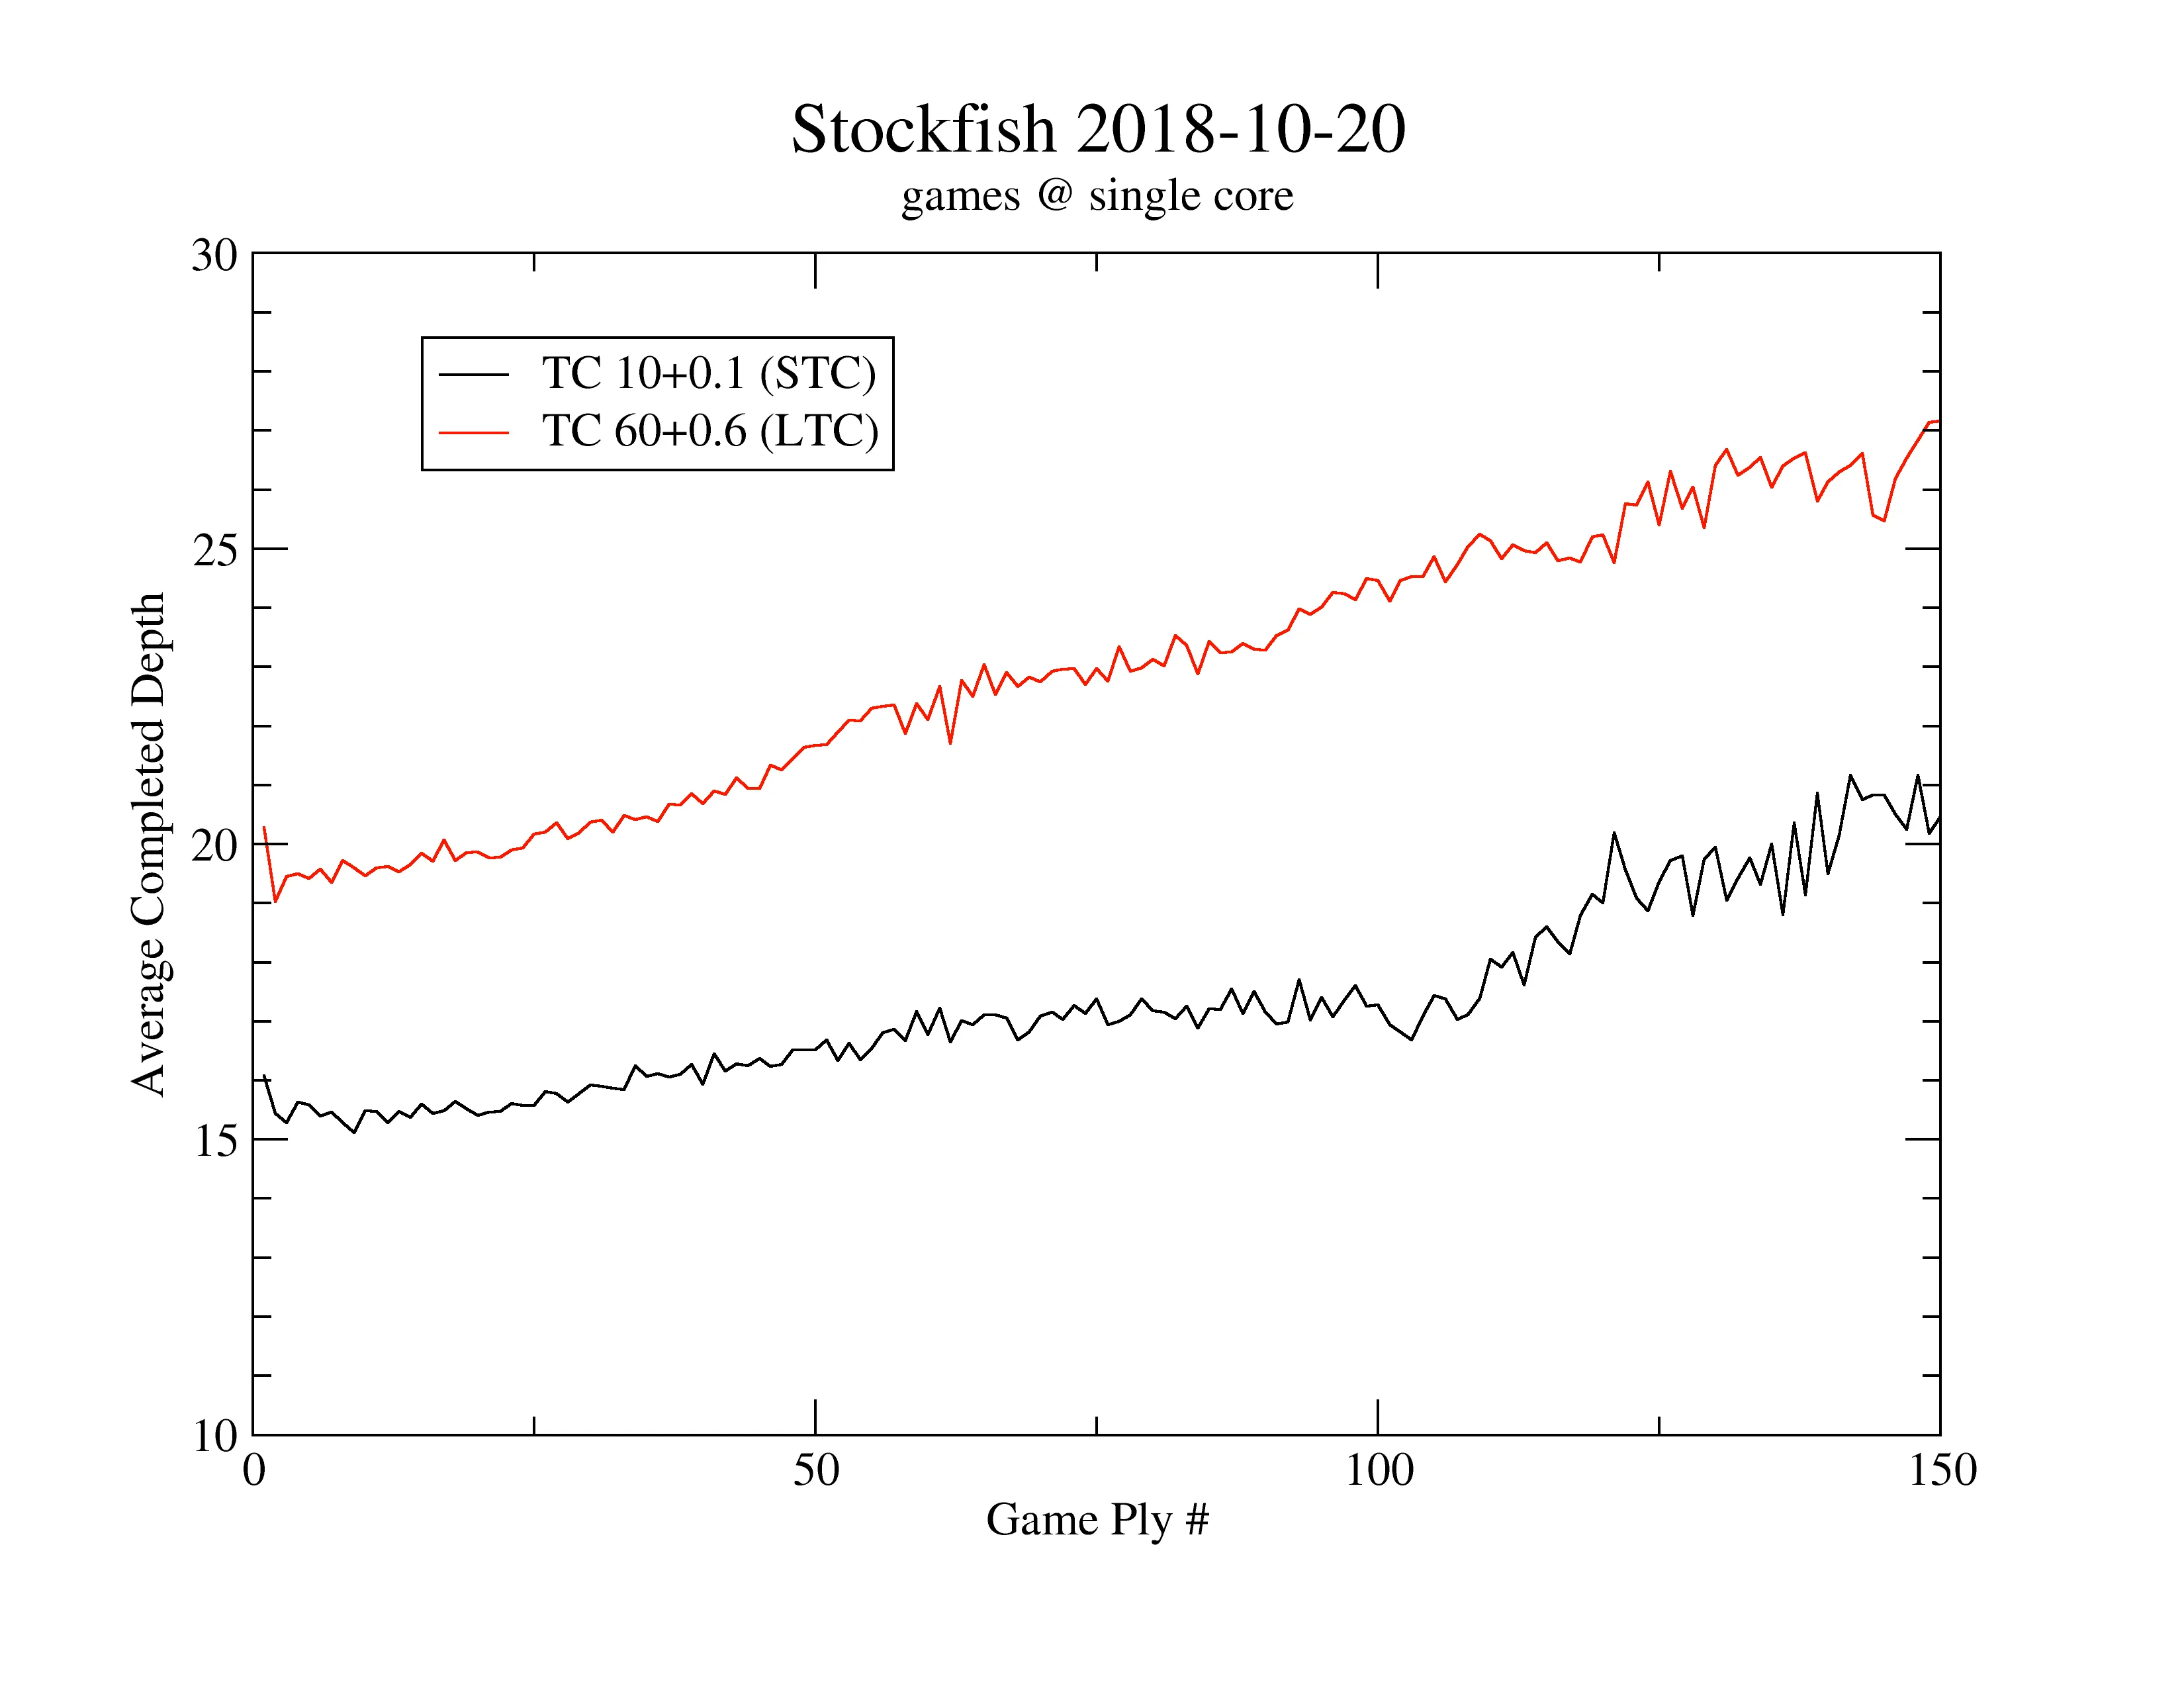
Depth vs. TC
Newer and older results showing the average depth for games at fishtest conditions
| New | Old |
|---|---|
 |  |
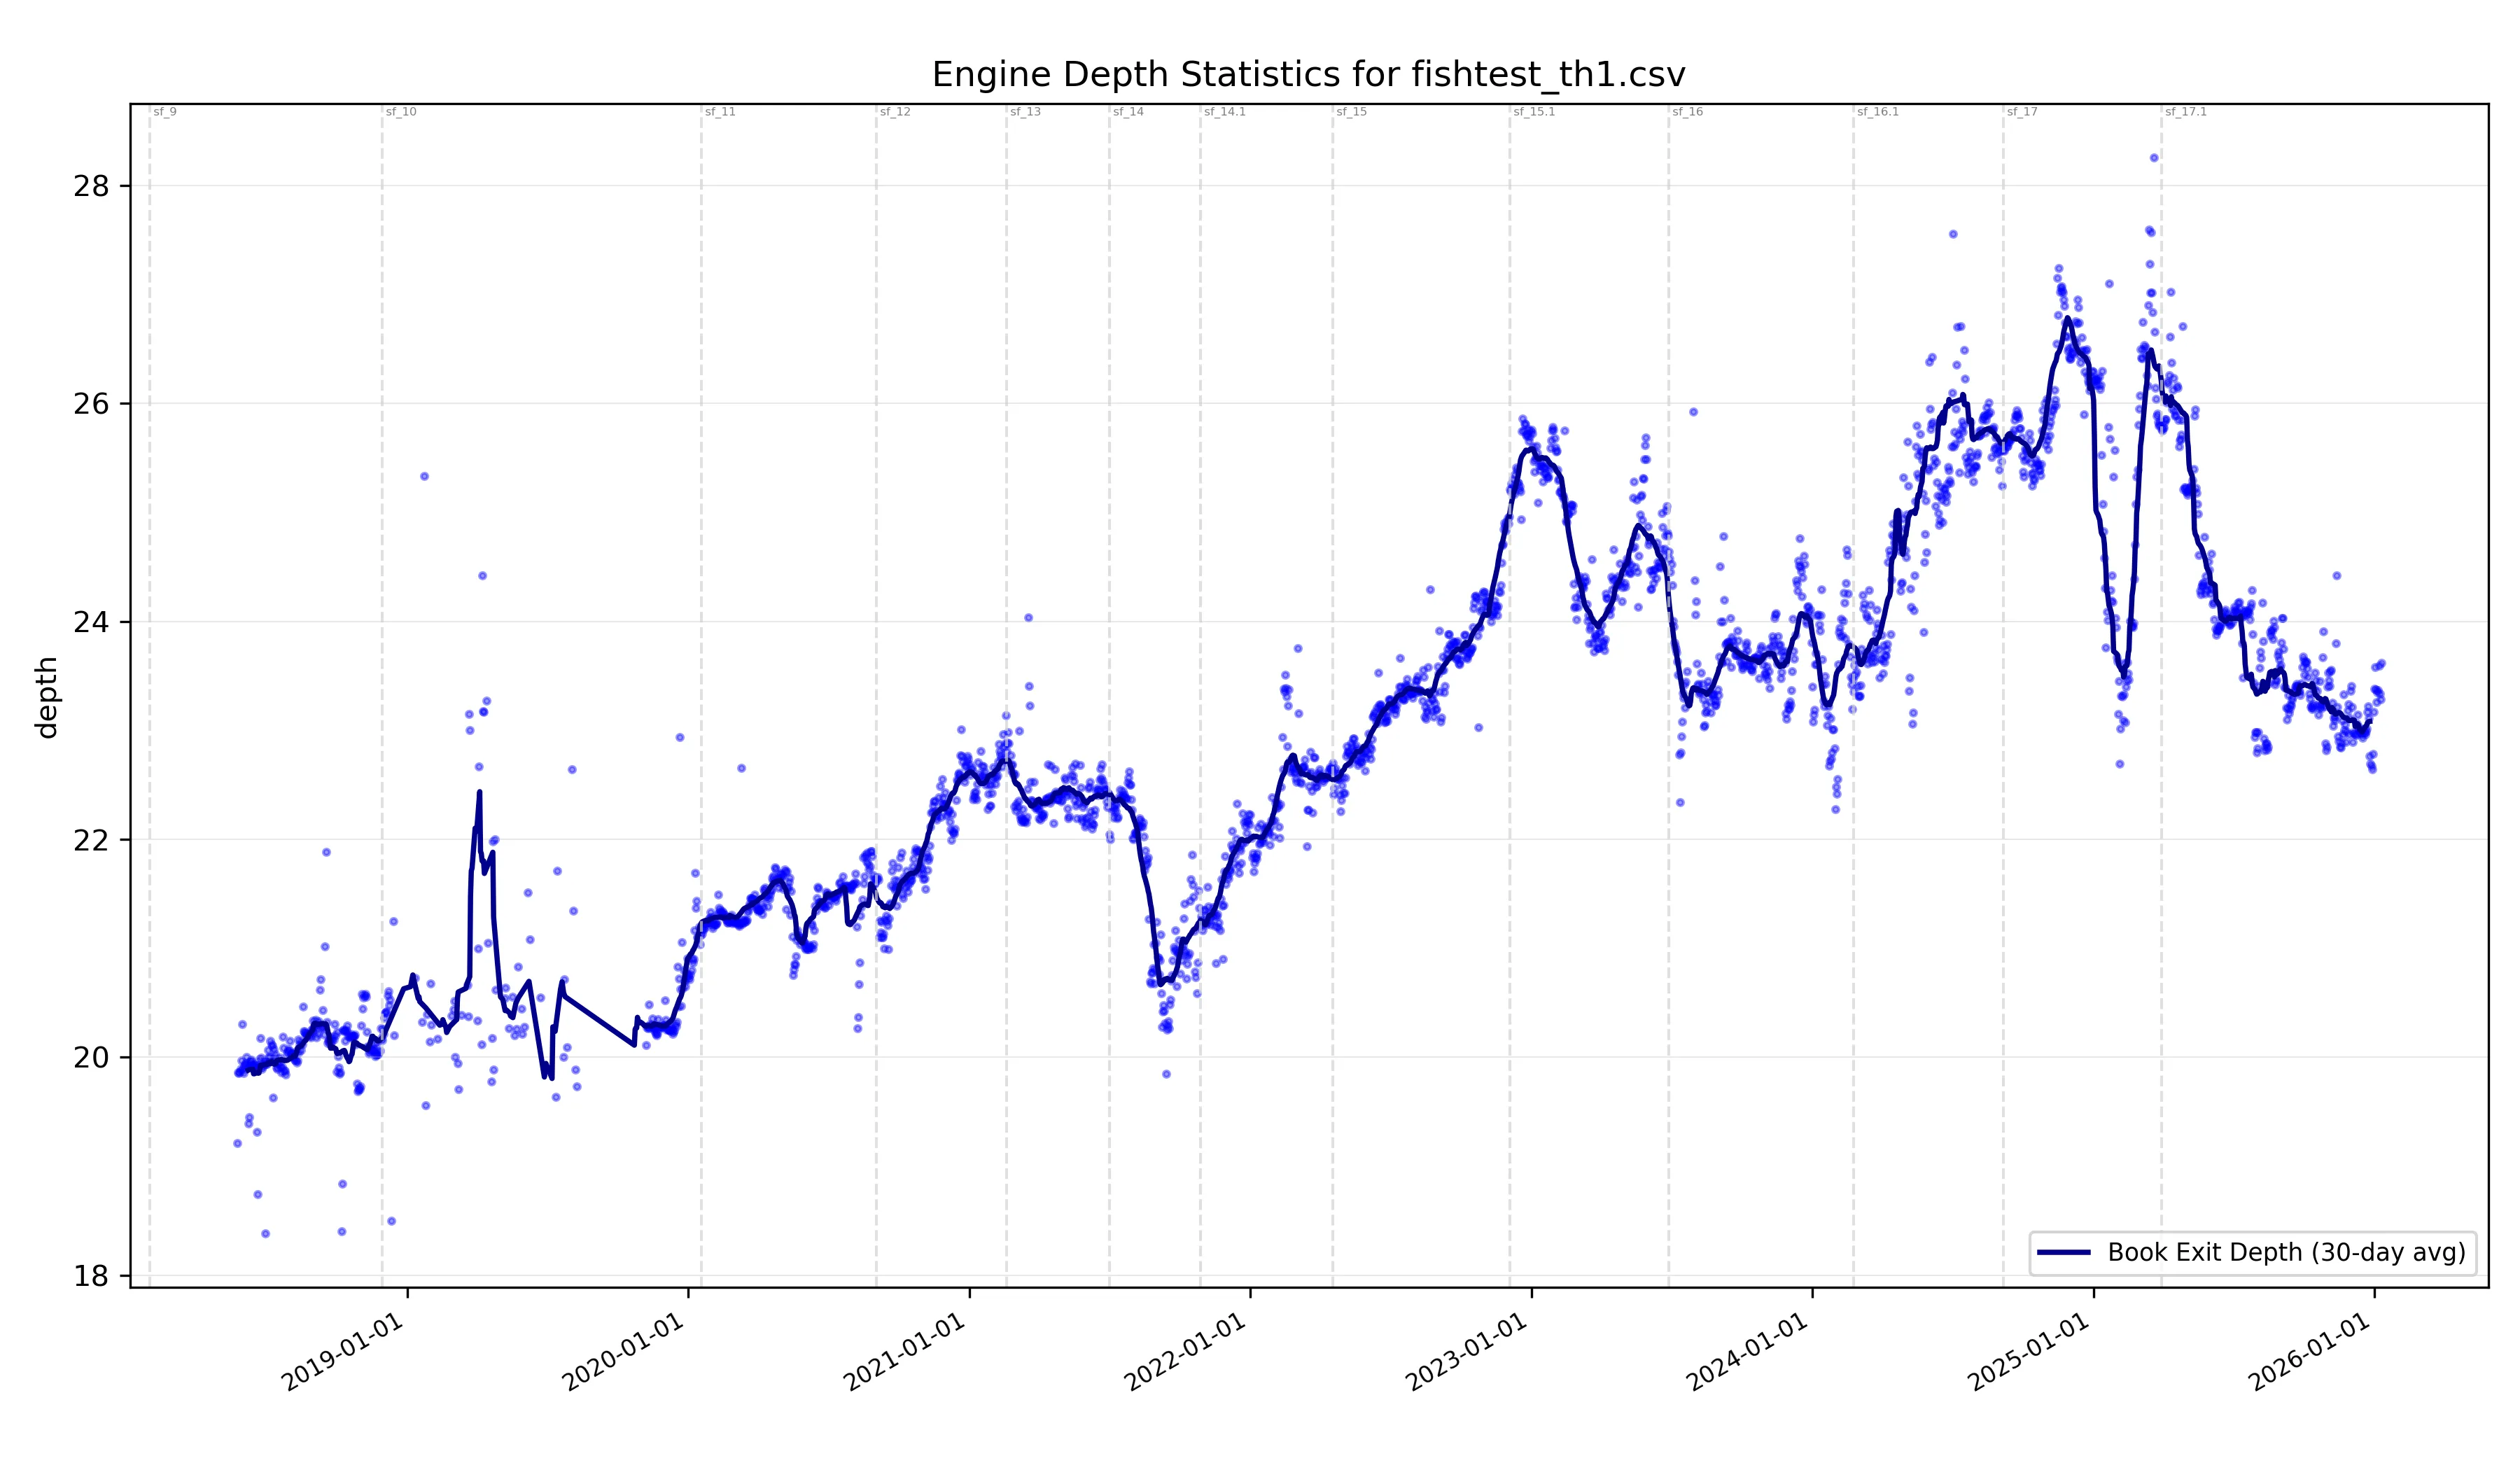
Depth at LTC book exit
An analysis of the single threaded tests within the Fishtest LTC collection. Data and plot produced with the code at depthanalysis.
Elo cost of small Hash
We measure the influence of Hash on the playing strength, using games of SF15.1 at LTC (60+0.6s) and VLTC (240+2.4s) on the UHO book. Hash is varied between 1 and 64 MB and 256MB in powers of two, leading to as average hashfull between 100 and 950 per thousand. The data suggests that keeping the average hashfull below 30% is best to maintain strength.
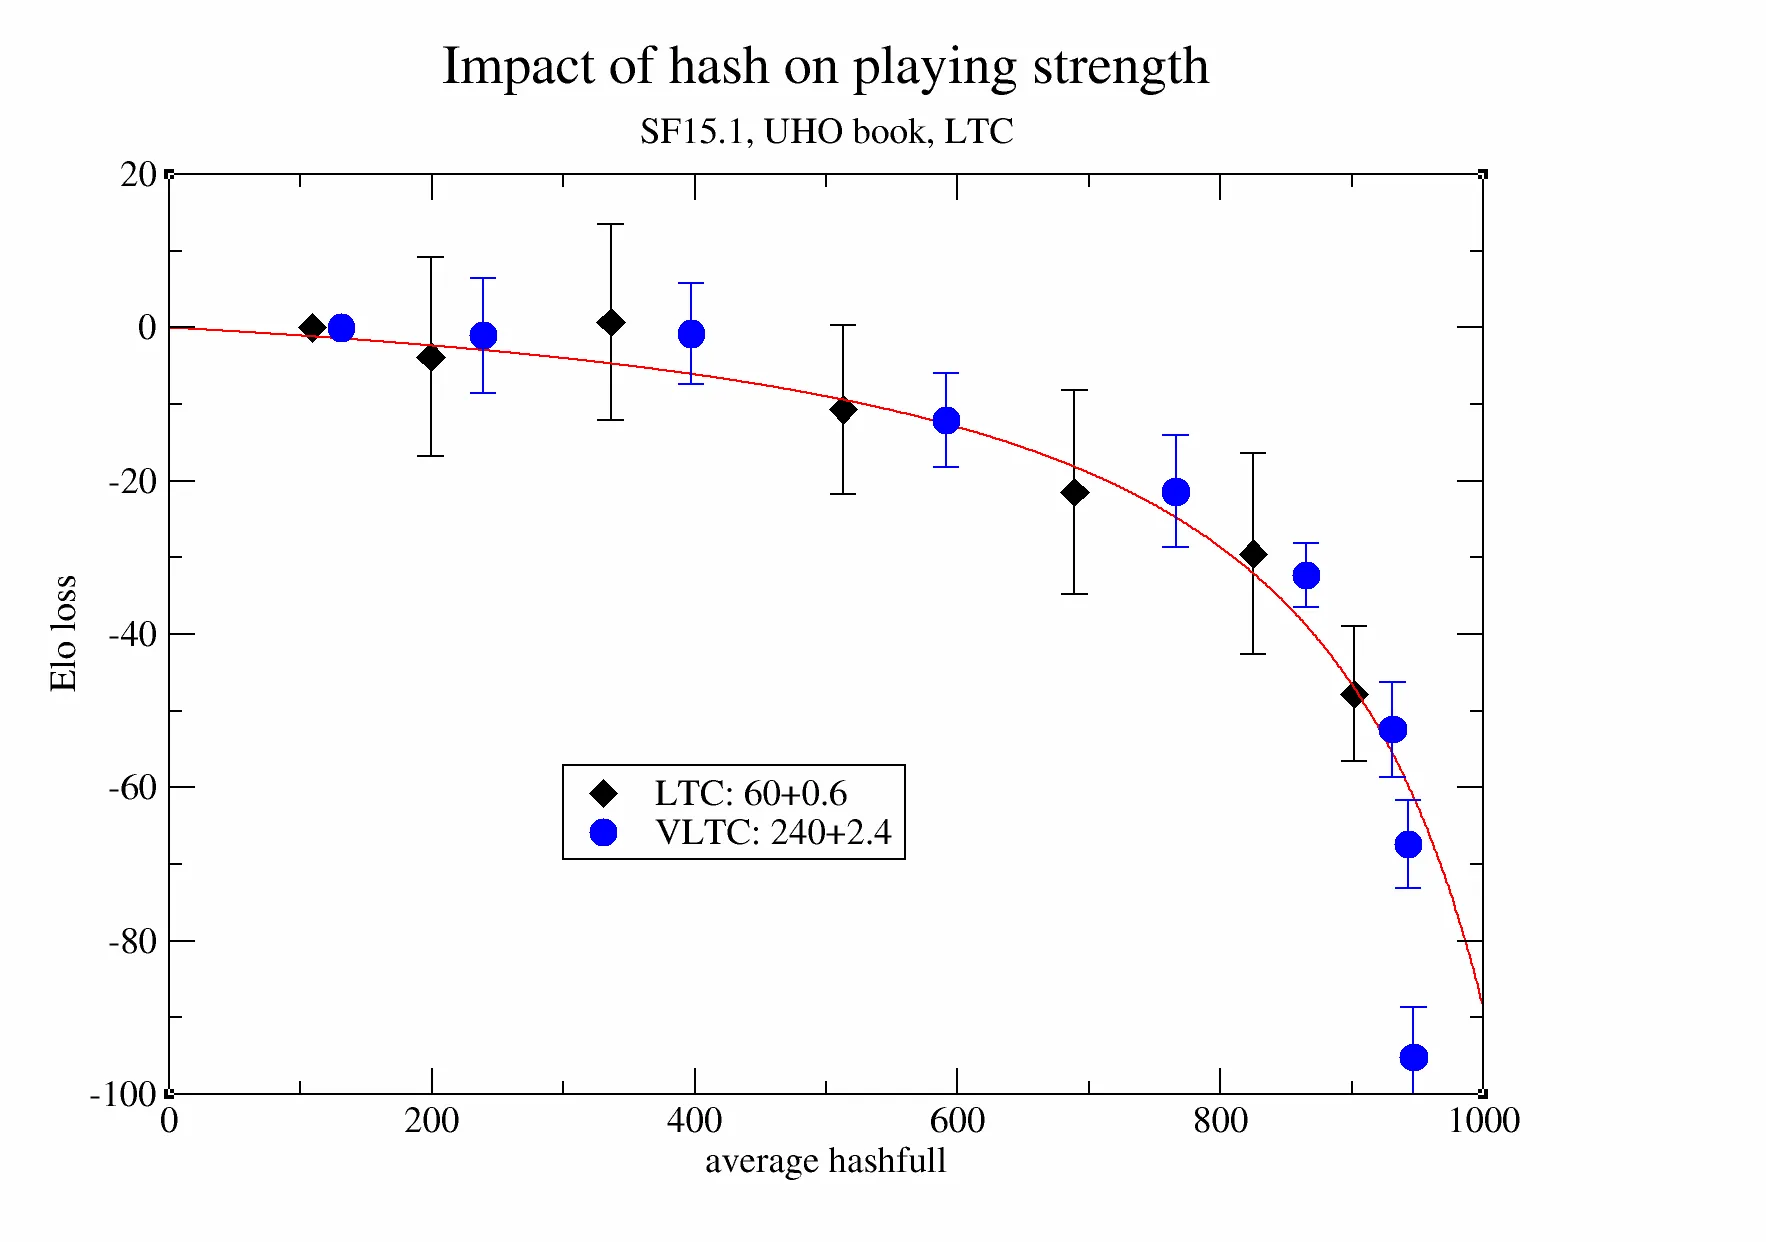
Raw data for the above graph
| Hash | Hashfull | Elo | Elo-err |
|---|---|---|---|
| 64 | 109 | 0.00 | 0.00 |
| 32 | 199 | -3.80 | 13.00 |
| 16 | 336 | 0.70 | 12.80 |
| 8 | 513 | -10.70 | 11.00 |
| 4 | 689 | -21.50 | 13.30 |
| 2 | 825 | -29.50 | 13.10 |
| 1 | 902 | -47.80 | 8.80 |
| Hash | Hashfull | Elo | Elo-err |
|---|---|---|---|
| 256 | 131 | 0.00 | 0.00 |
| 128 | 239 | -1.00 | 7.50 |
| 64 | 397 | -0.80 | 6.60 |
| 32 | 591 | -12.10 | 6.10 |
| 16 | 766 | -21.40 | 7.30 |
| 8 | 865 | -32.30 | 4.20 |
| 4 | 931 | -52.40 | 6.20 |
| 2 | 943 | -67.40 | 5.70 |
| 1 | 947 | -95.20 | 6.60 |
Elo cost of using MultiPV
MultiPV provides the N best moves and their principal variations. This is a great tool for understanding the options available in a given position. However, this information does not come for free and the cost of computing it reduces the quality of the best move found compared to a search that only needs to find a single line.
| MultiPV | Elo | Elo-err |
|---|---|---|
| 1 | 0.0 | 0.0 |
| 2 | -97.2 | 2.1 |
| 3 | -156.7 | 2.8 |
| 4 | -199.3 | 2.9 |
| 5 | -234.5 | 2.8 |
Engine: Stockfish 15.1
Time control: 60s+0.6s
Book: UHO
Elo gain using MultiPV at fixed depth
| MultiPV | Elo | Elo-err | Points | Played |
|---|---|---|---|---|
| 1 | 0.0 | 13496.5 | 30614 | |
| 2 | 45.7 | 3.1 | 15388.0 | 30697 |
| 3 | 53.9 | 3.5 | 15732.5 | 30722 |
| 4 | 59.5 | 3.2 | 15862.5 | 30479 |
| 5 | 63.7 | 3.6 | 16078.5 | 30604 |
Time control: 580s+5.8s
Depth: 18
Elo gain using syzygy
TB6 testing for various versions of SF
Consistent measurement of Elo gain (syzygy 6men vs none) for various SF versions:
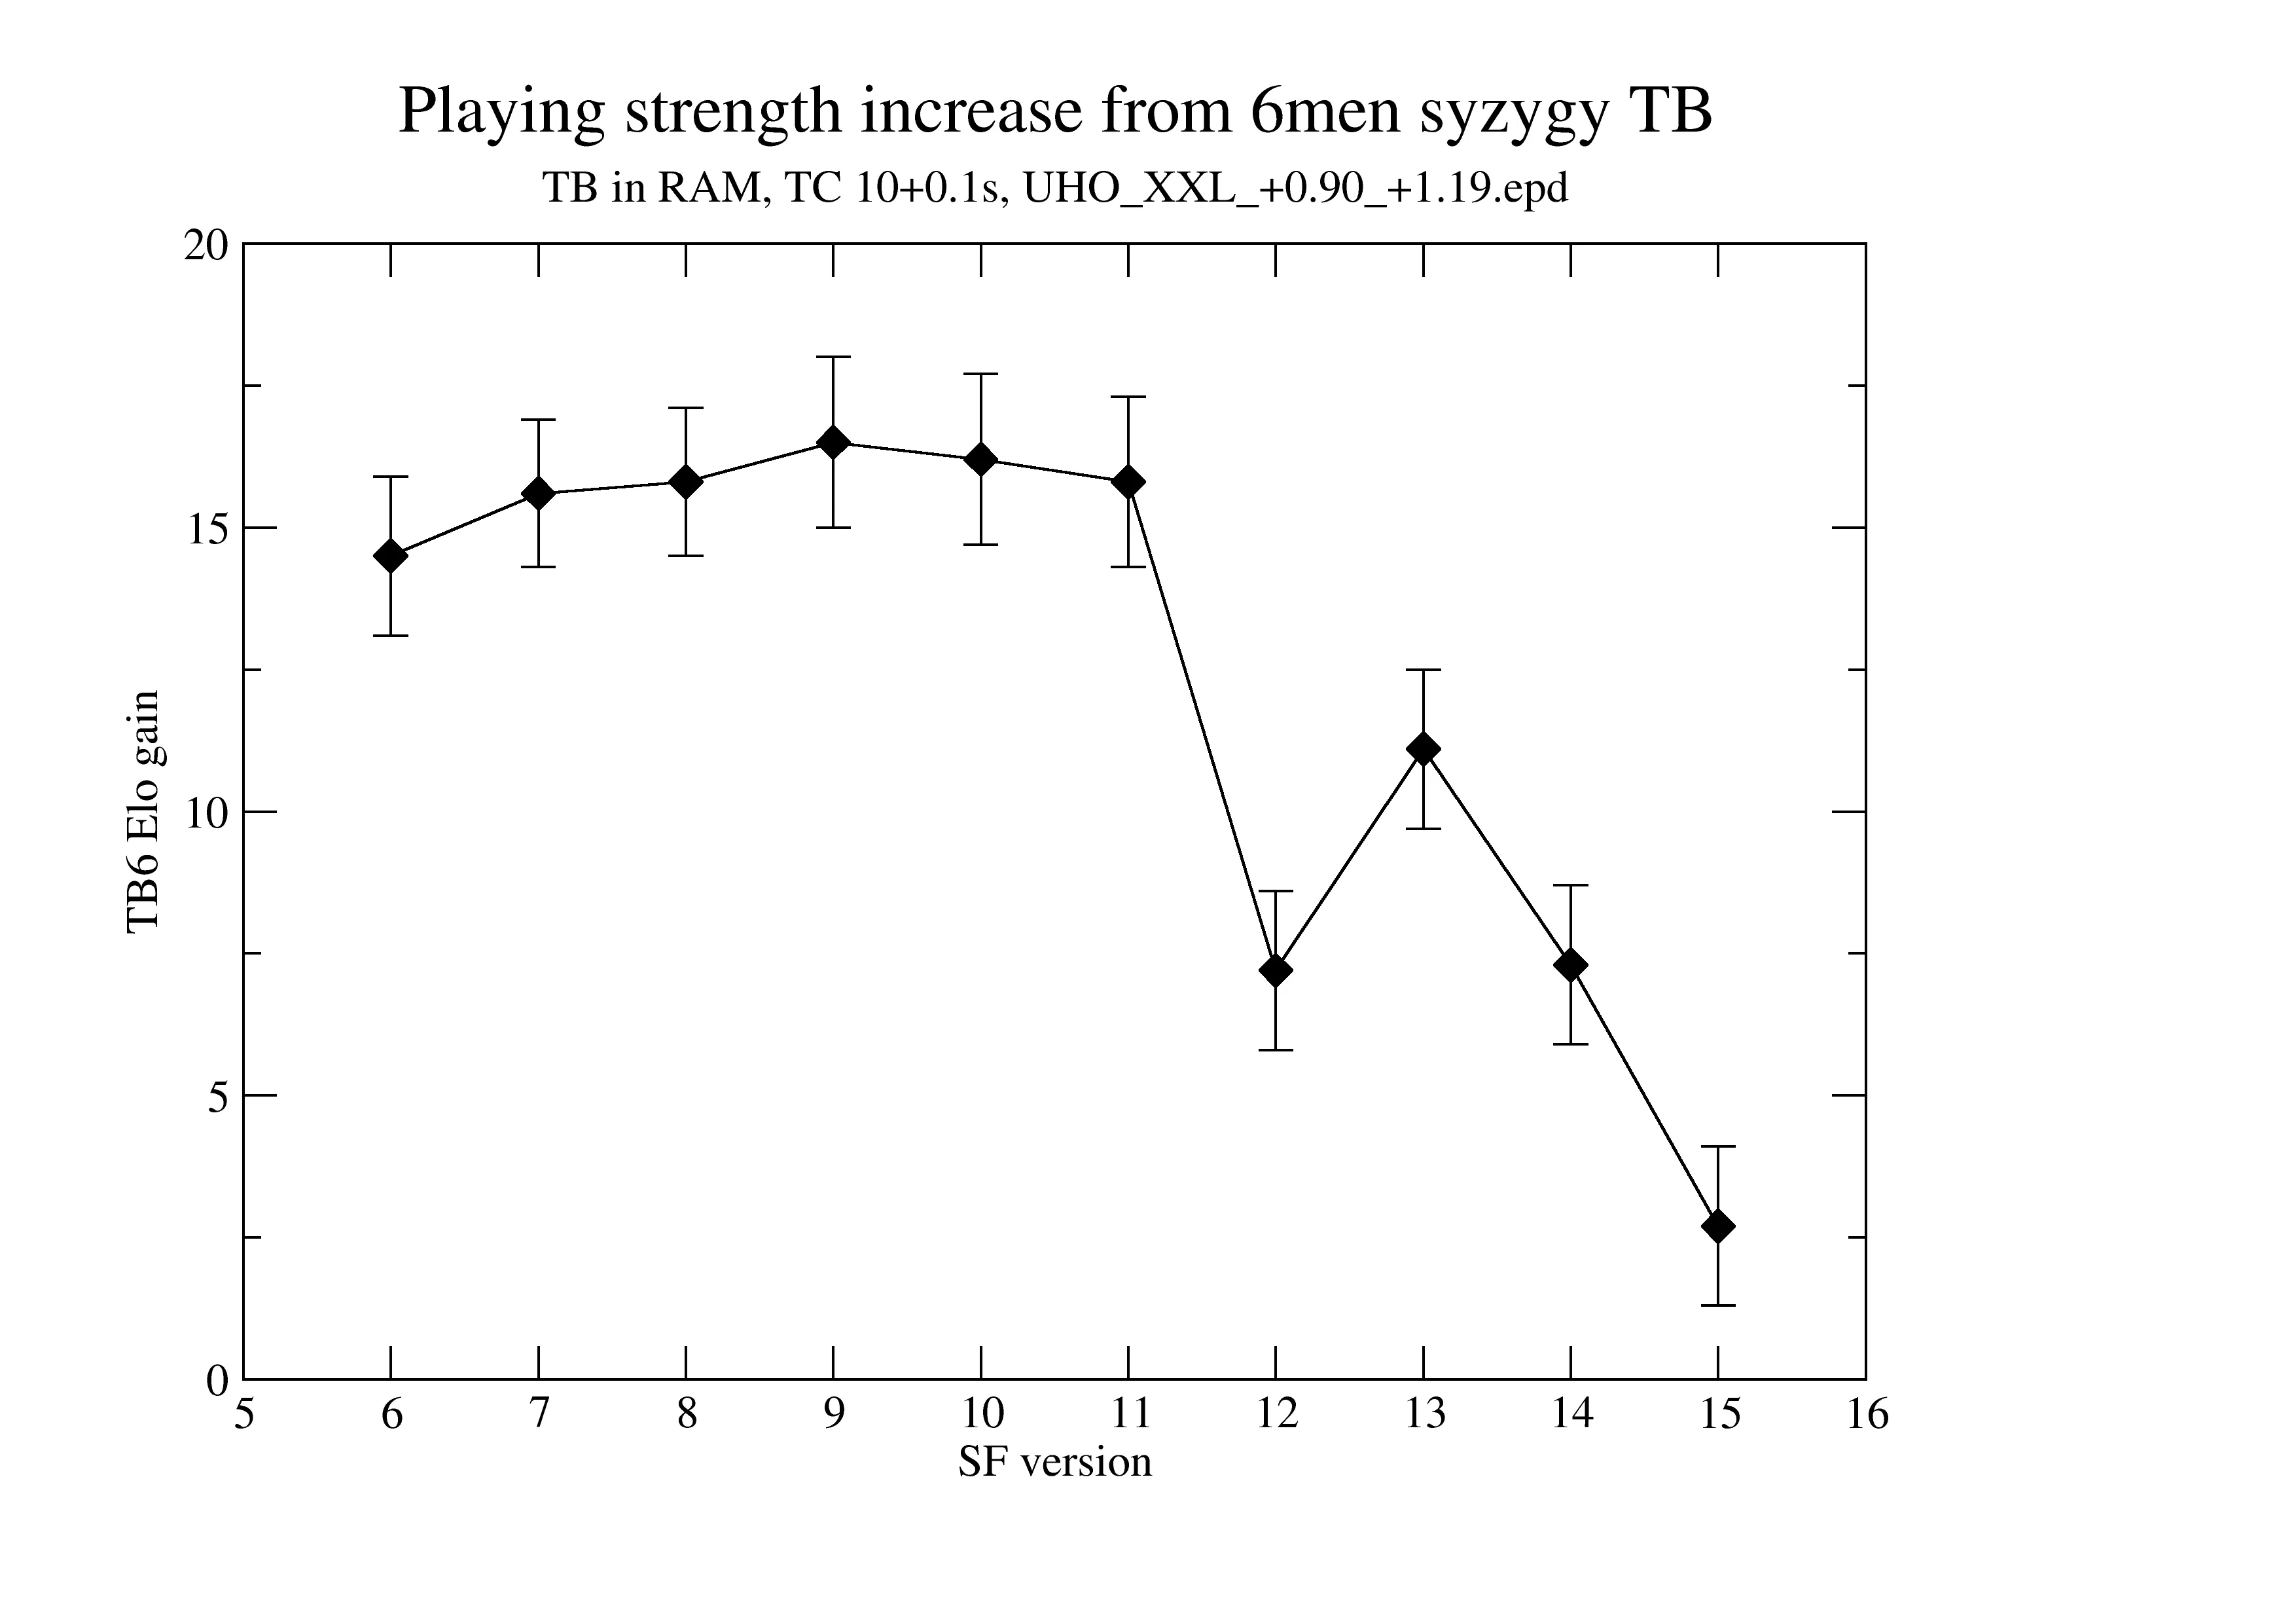
TB are in RAM (so fast access), TC is 10+0.1s (STC), book UHO_XXL_+0.90_+1.19.epd. No adjudication. The introduction of NNUE (with SF12) is clearly visible. With SF15, there is just 2.7 Elo gain.
Raw data for the above graph
| SF | Elo | Elo-err |
|---|---|---|
| 6 | 14.5 | 1.4 |
| 7 | 15.6 | 1.3 |
| 8 | 15.8 | 1.3 |
| 9 | 16.5 | 1.5 |
| 10 | 16.2 | 1.5 |
| 11 | 15.8 | 1.5 |
| 12 | 7.2 | 1.4 |
| 13 | 11.1 | 1.4 |
| 14 | 7.3 | 1.4 |
| 15 | 2.7 | 1.4 |
TB6 on SSD
Tested at 10+0.1, 6men TB on very fast M2 SSD, Stockfish 17.1:
Results of Stockfish vs StockfishSyzygy (10+0.1, 1t, 16MB, UHO_XXL_+0.90_+1.19.pgn):
Elo: -1.26 +/- 1.46, nElo: -2.64 +/- 3.05
LOS: 4.46 %, DrawRatio: 57.40 %, PairsRatio: 0.96
Games: 50000, Wins: 13671, Losses: 13853, Draws: 22476, Points: 24909.0 (49.82 %)
Ptnml(0-2): [130, 5293, 14349, 5085, 143], WL/DD Ratio: 1.37
Testing depending on number of pieces and TC
Tested at 10+0.1, with all syzygy WDL files on tmpfs (i.e. RAM), testing using none(0), 4, 5, and 6 man TB in a round-robin tournament (SF10dev).
| Rank | Name | Elo | +/- | Games | Score | Draws |
|---|---|---|---|---|---|---|
| 1 | syzygy6 | 13 | 2 | 82591 | 51.8% | 59.5% |
| 2 | syzygy5 | 2 | 2 | 82590 | 50.3% | 59.4% |
| 3 | syzygy4 | -7 | 2 | 82591 | 49.0% | 59.3% |
| 4 | syzygy0 | -7 | 2 | 82592 | 48.9% | 59.4% |
Tested at 60+0.6, with all syzygy WDL files on tmpfs (i.e. RAM), testing using none(0) against 6 man TB:
Score of syzygy6 vs syzygy0: 4084 - 3298 - 18510 [0.515] 25892 Elo difference: 10.55 +/- 2.25
Threading efficiency and Elo gain.
Efficiency
Here we look at the threading efficiency of the lazySMP parallelization scheme. To focus on the algorithm we play games with a given budget of nodes rather than at a given TC. In principle, lazySMP has excellent scaling of the nps with cores, but practical measurement is influenced by e.g. frequency adjustments, SMT/hyperthreading, and sometimes hardware limitation.
Equivalent nodestime
In these tests, matches are played at a fixed nodes budget (using the nodestime feature of SF), and equivalence in strength between the serial player and the threaded player (for x threads in the graph below) is found by adjusting the number of nodes given to the threaded player (e.g. with 16 threads, the threaded player might need 200% of the nodes of the serial player to match the strength of the serial player). This 'equivalent nodestime' is determined for various number of threads and various nodes budgets (60+0.6Mnodes/game is somewhat similar to our usual LTC at 60+0.6s/game, if we assume 1Mnps).
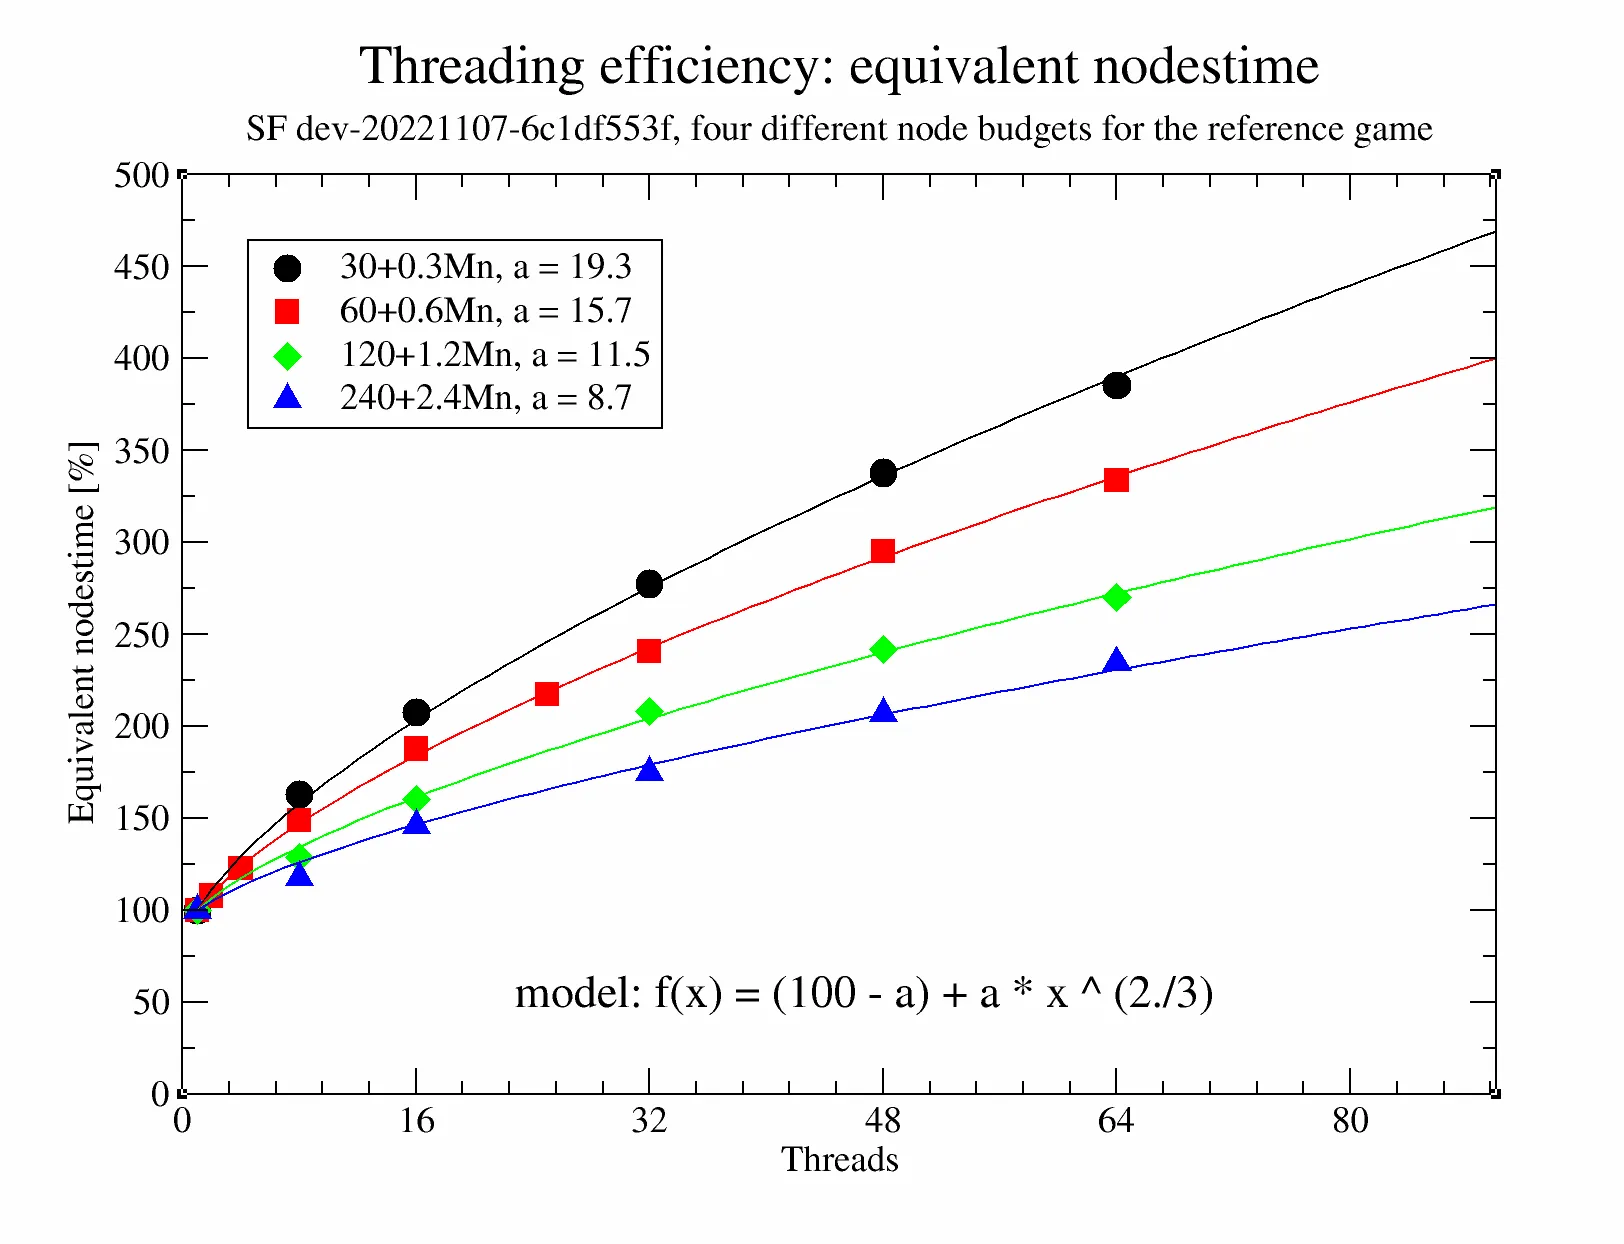
The interesting observation one can make immediately is that this 'equivalent nodestime' grows with the number of threads, but not too steeply, and further more that the 'equivalent nodestime' decreases with increasing nodes budget. The data shows that with 64 threads, the equivalent nodestime is about 200% for a node budget of 240+2.4Mn, i.e. despite such games being much faster than STC (10+0.1s), efficiency is still around 50%.
The curves are sufficiently smooth to be fitted with a model having 1 parameter that is different between the curves (f(x), parameter a, see caption). A smaller value of a means a higher efficiency.
A fit for the a parameter, and extrapolation to long TCs.
The above parameter a from the model, can be fit as a function of nodes budget, this allows for extrapolating the parameter, and to arrive at and estimate for the 'equivalent nodestime' at large TC / nodes budgets:
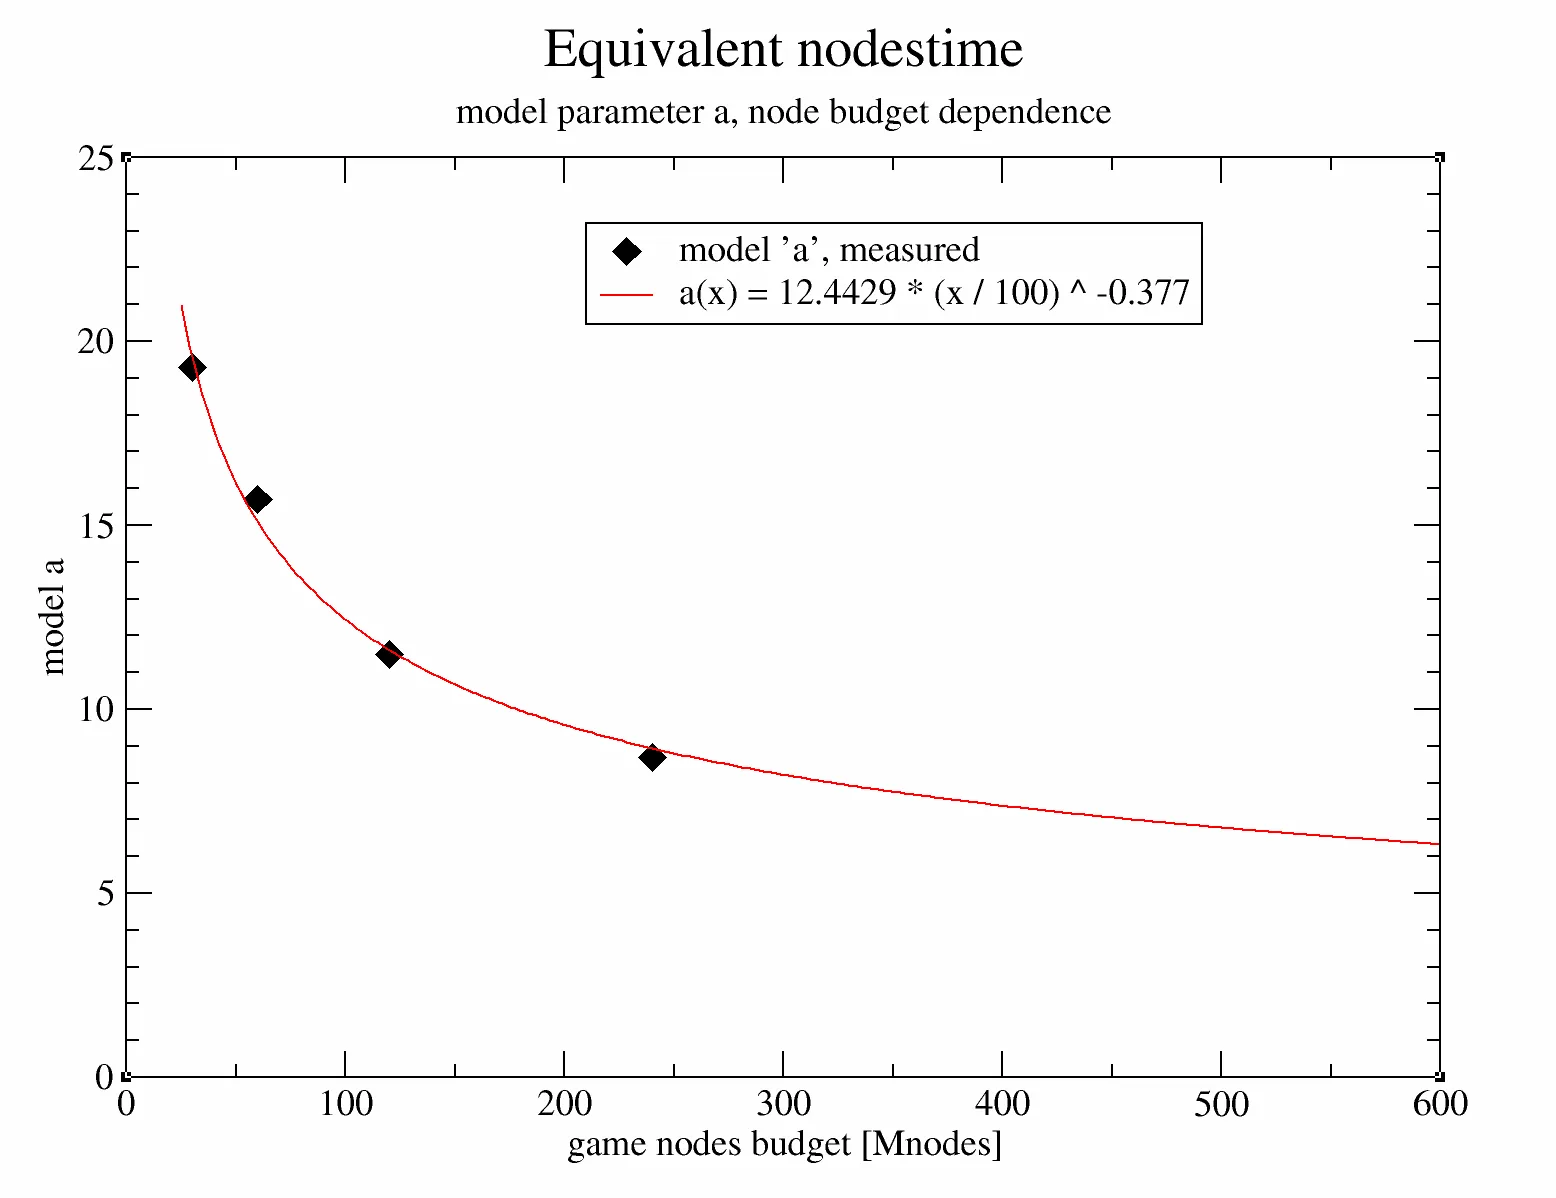
The fit is again fairly good. Taking a leap of faith, these measurements at up to 240+2.4Mn can be extrapolated to node budgets typical of TCEC or CCC (up to 500Gn). This allows us to predict speedup and/or efficiency.
| Speedup | Efficiency |
|---|---|
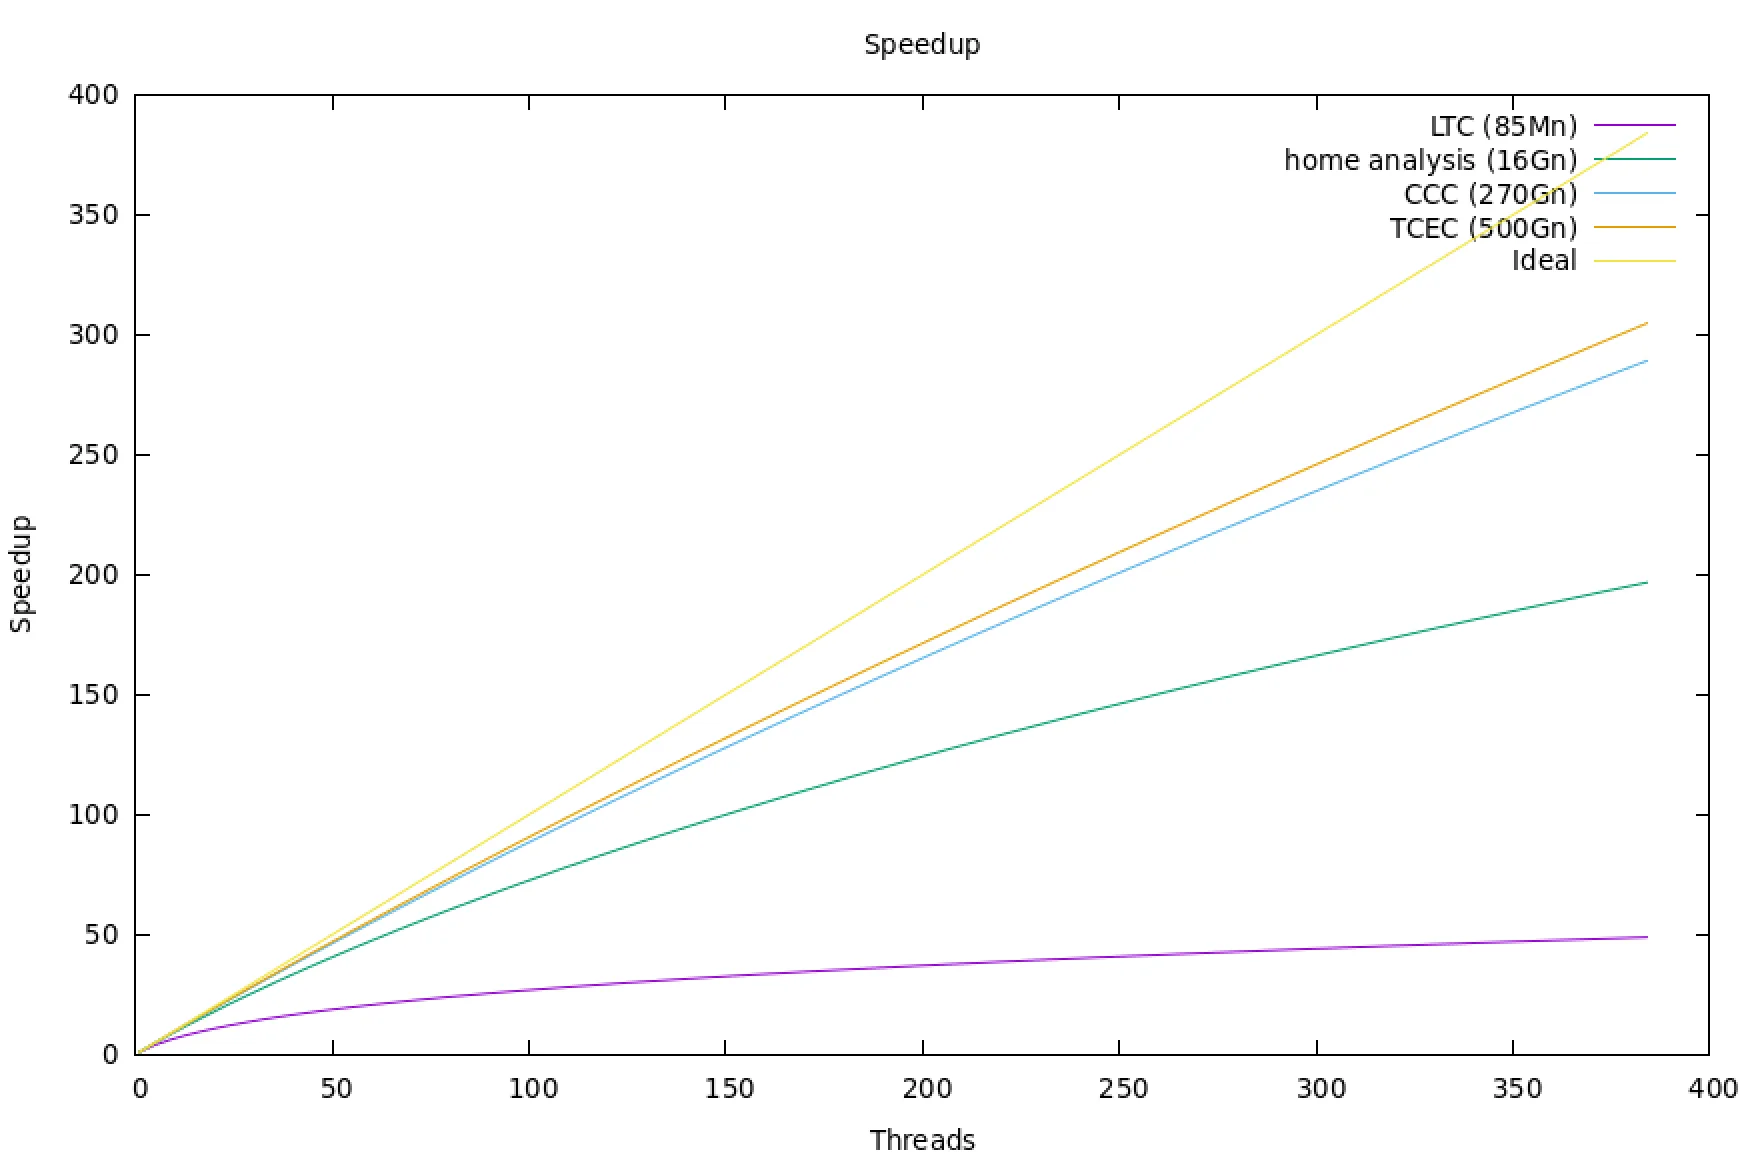 | 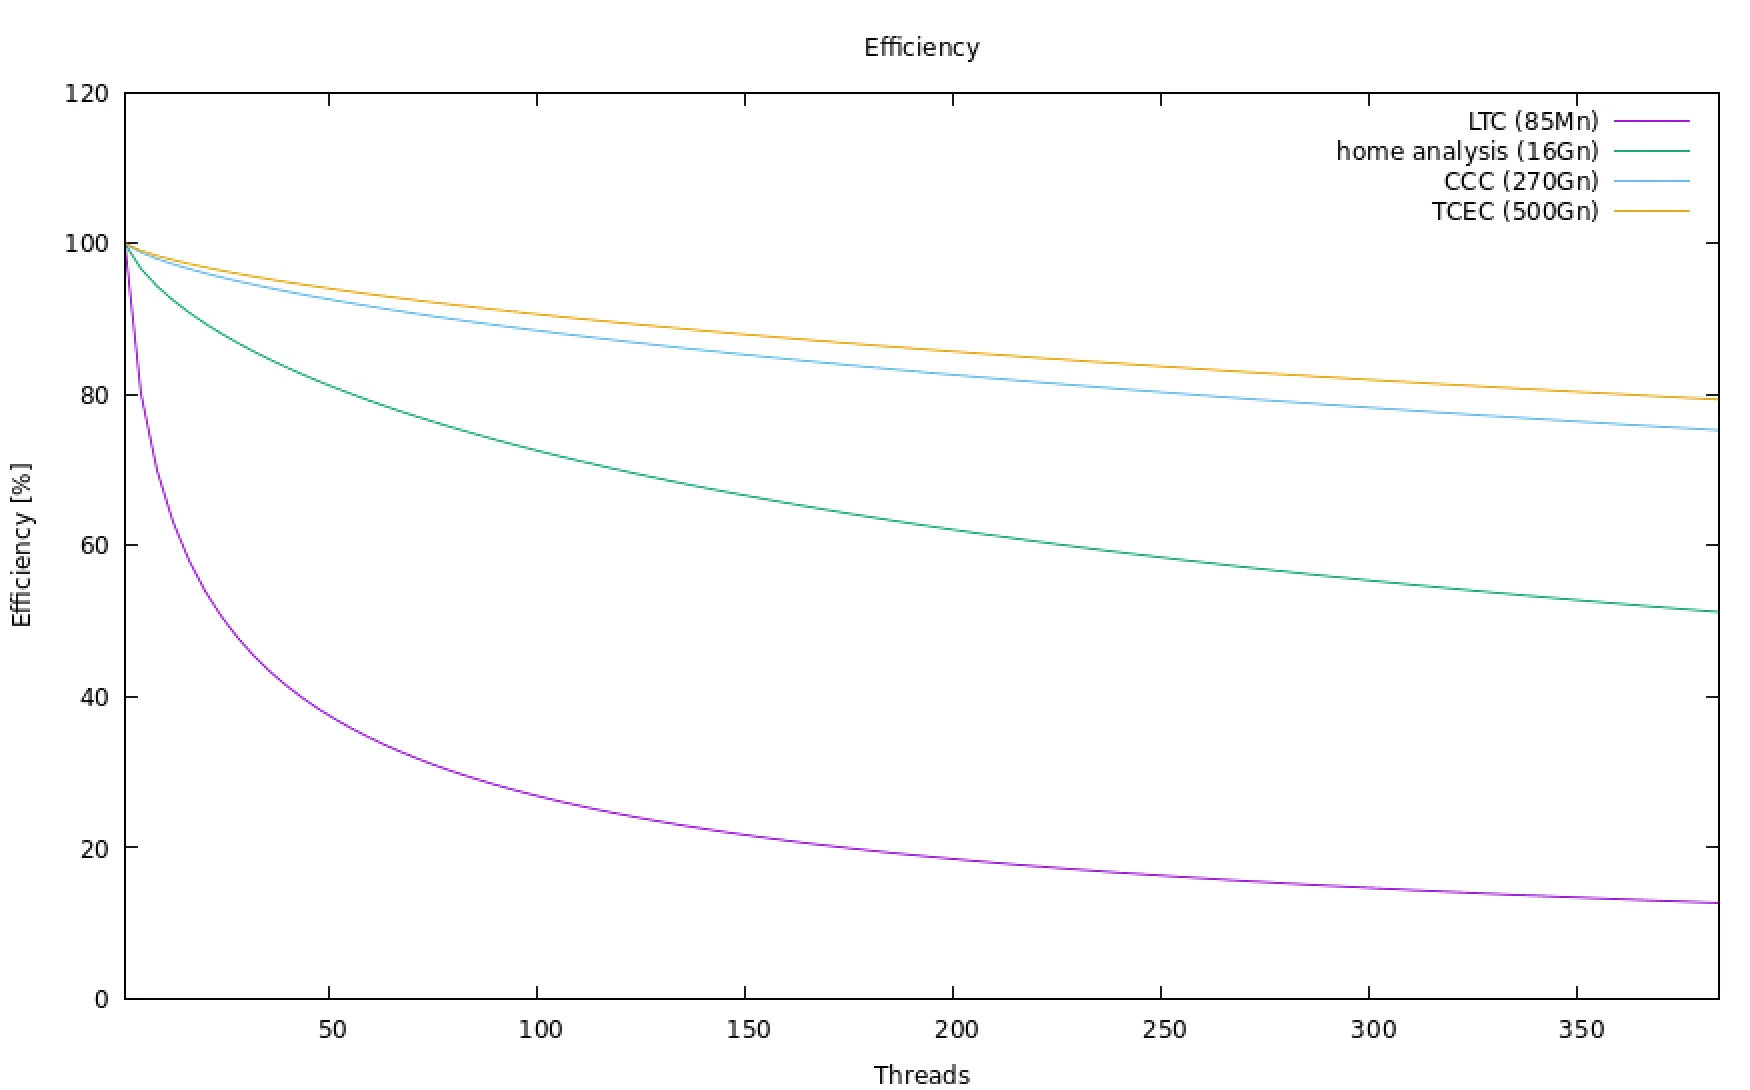 |
These extrapolations suggest that even at thread counts of >300, at TCEC TCs efficiency could be 80% or higher, provided the nps scales with the number of threads.
Elo results (older)
LTC
Playing 8 threads vs 1 thread at LTC (60+0.6, 8moves_v3.pgn):
Score of t8 vs seq: 476 - 3 - 521  [0.737] 1000
Elo difference: 178.6 +/- 14.0, LOS: 100.0 %, DrawRatio: 52.1 %
Playing 1 thread at 8xLTC (480+4.8) vs (60+0.6) (8moves_v3.pgn):
Score of seq8 vs seq: 561 - 5 - 434  [0.778] 1000
Elo difference: 217.9 +/- 15.8, LOS: 100.0 %, DrawRatio: 43.4 %
Which is roughly 82% efficiency (178/218).
STC
Playing 8 threads vs 1 thread at STC (10+0.1):
Score of threads vs serial: 1606 - 15 - 540  [0.868] 2161
Elo difference: 327.36 +/- 14.59
Playing 8 threads @ 10+0.1 vs 1 thread @ 80+0.8:
Score of threads vs time: 348 - 995 - 2104  [0.406] 3447
Elo difference: -66.00 +/- 7.15
So, 1 -> 8 threads has about 83% scaling efficiency (327 / (327 + 66)) using this test.
Elo from speedups
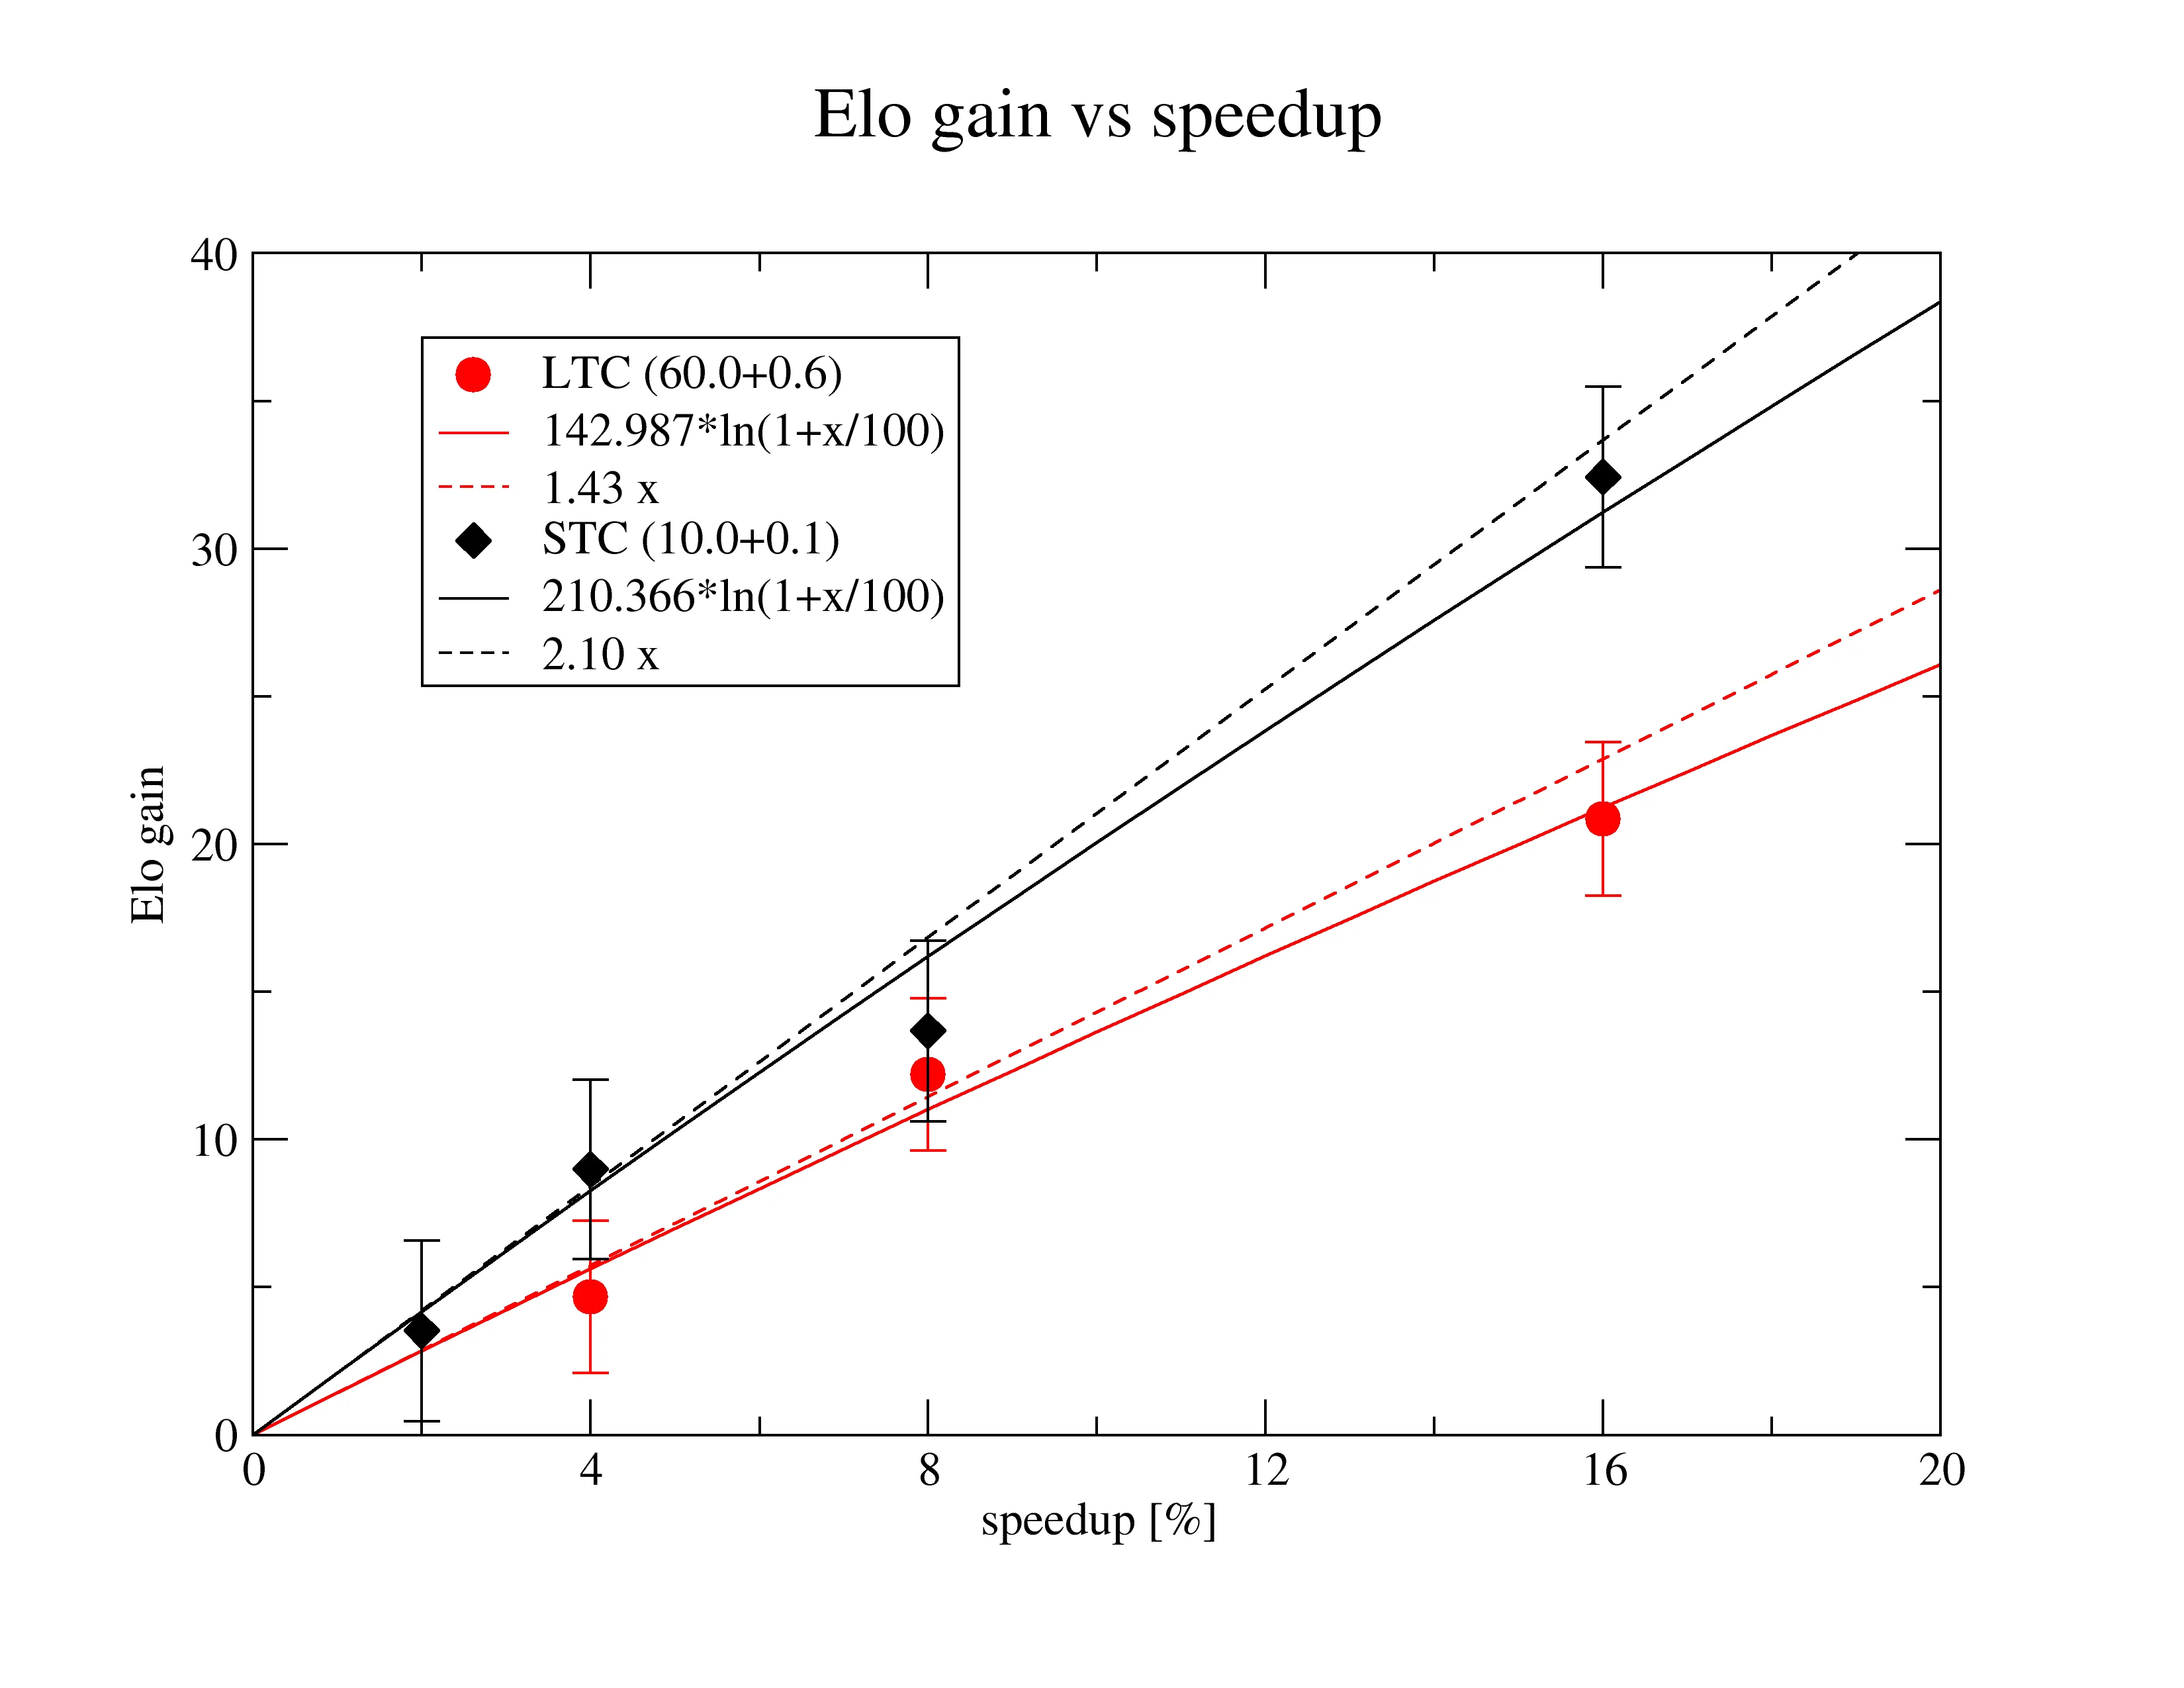
For small speedups (<~5%) the linear estimate can be used that gives Elo gain as a function of speedup percentage (x) as:
Elo_stc(x) = 2.10 x
Elo_ltc(x) = 1.43 x
To have 50% passing chance at STC<-0.5,1.5>, we need a 0.24% speedup, while at LTC<0.25,1.75> we need 0.70% speedup. A 1% speedup has nearly 85% passing chance at LTC.
Raw data:
tc 10+0.1:
16   32.42  3.06
 8   13.67  3.05
 4    8.99  3.04
 2    3.52  3.05

tc 60+0.6:
16   20.85  2.59
 8   12.20  2.57
 4    4.67  2.57
_Note: Numbers will depend on the precise hardware. The model was verified quite accurately on fishtest see https://github.com/locutus2/Stockfish-old/commit/82958c97214b6d418e5bc95e3bf1961060cd6113#commitcomment-38646654_
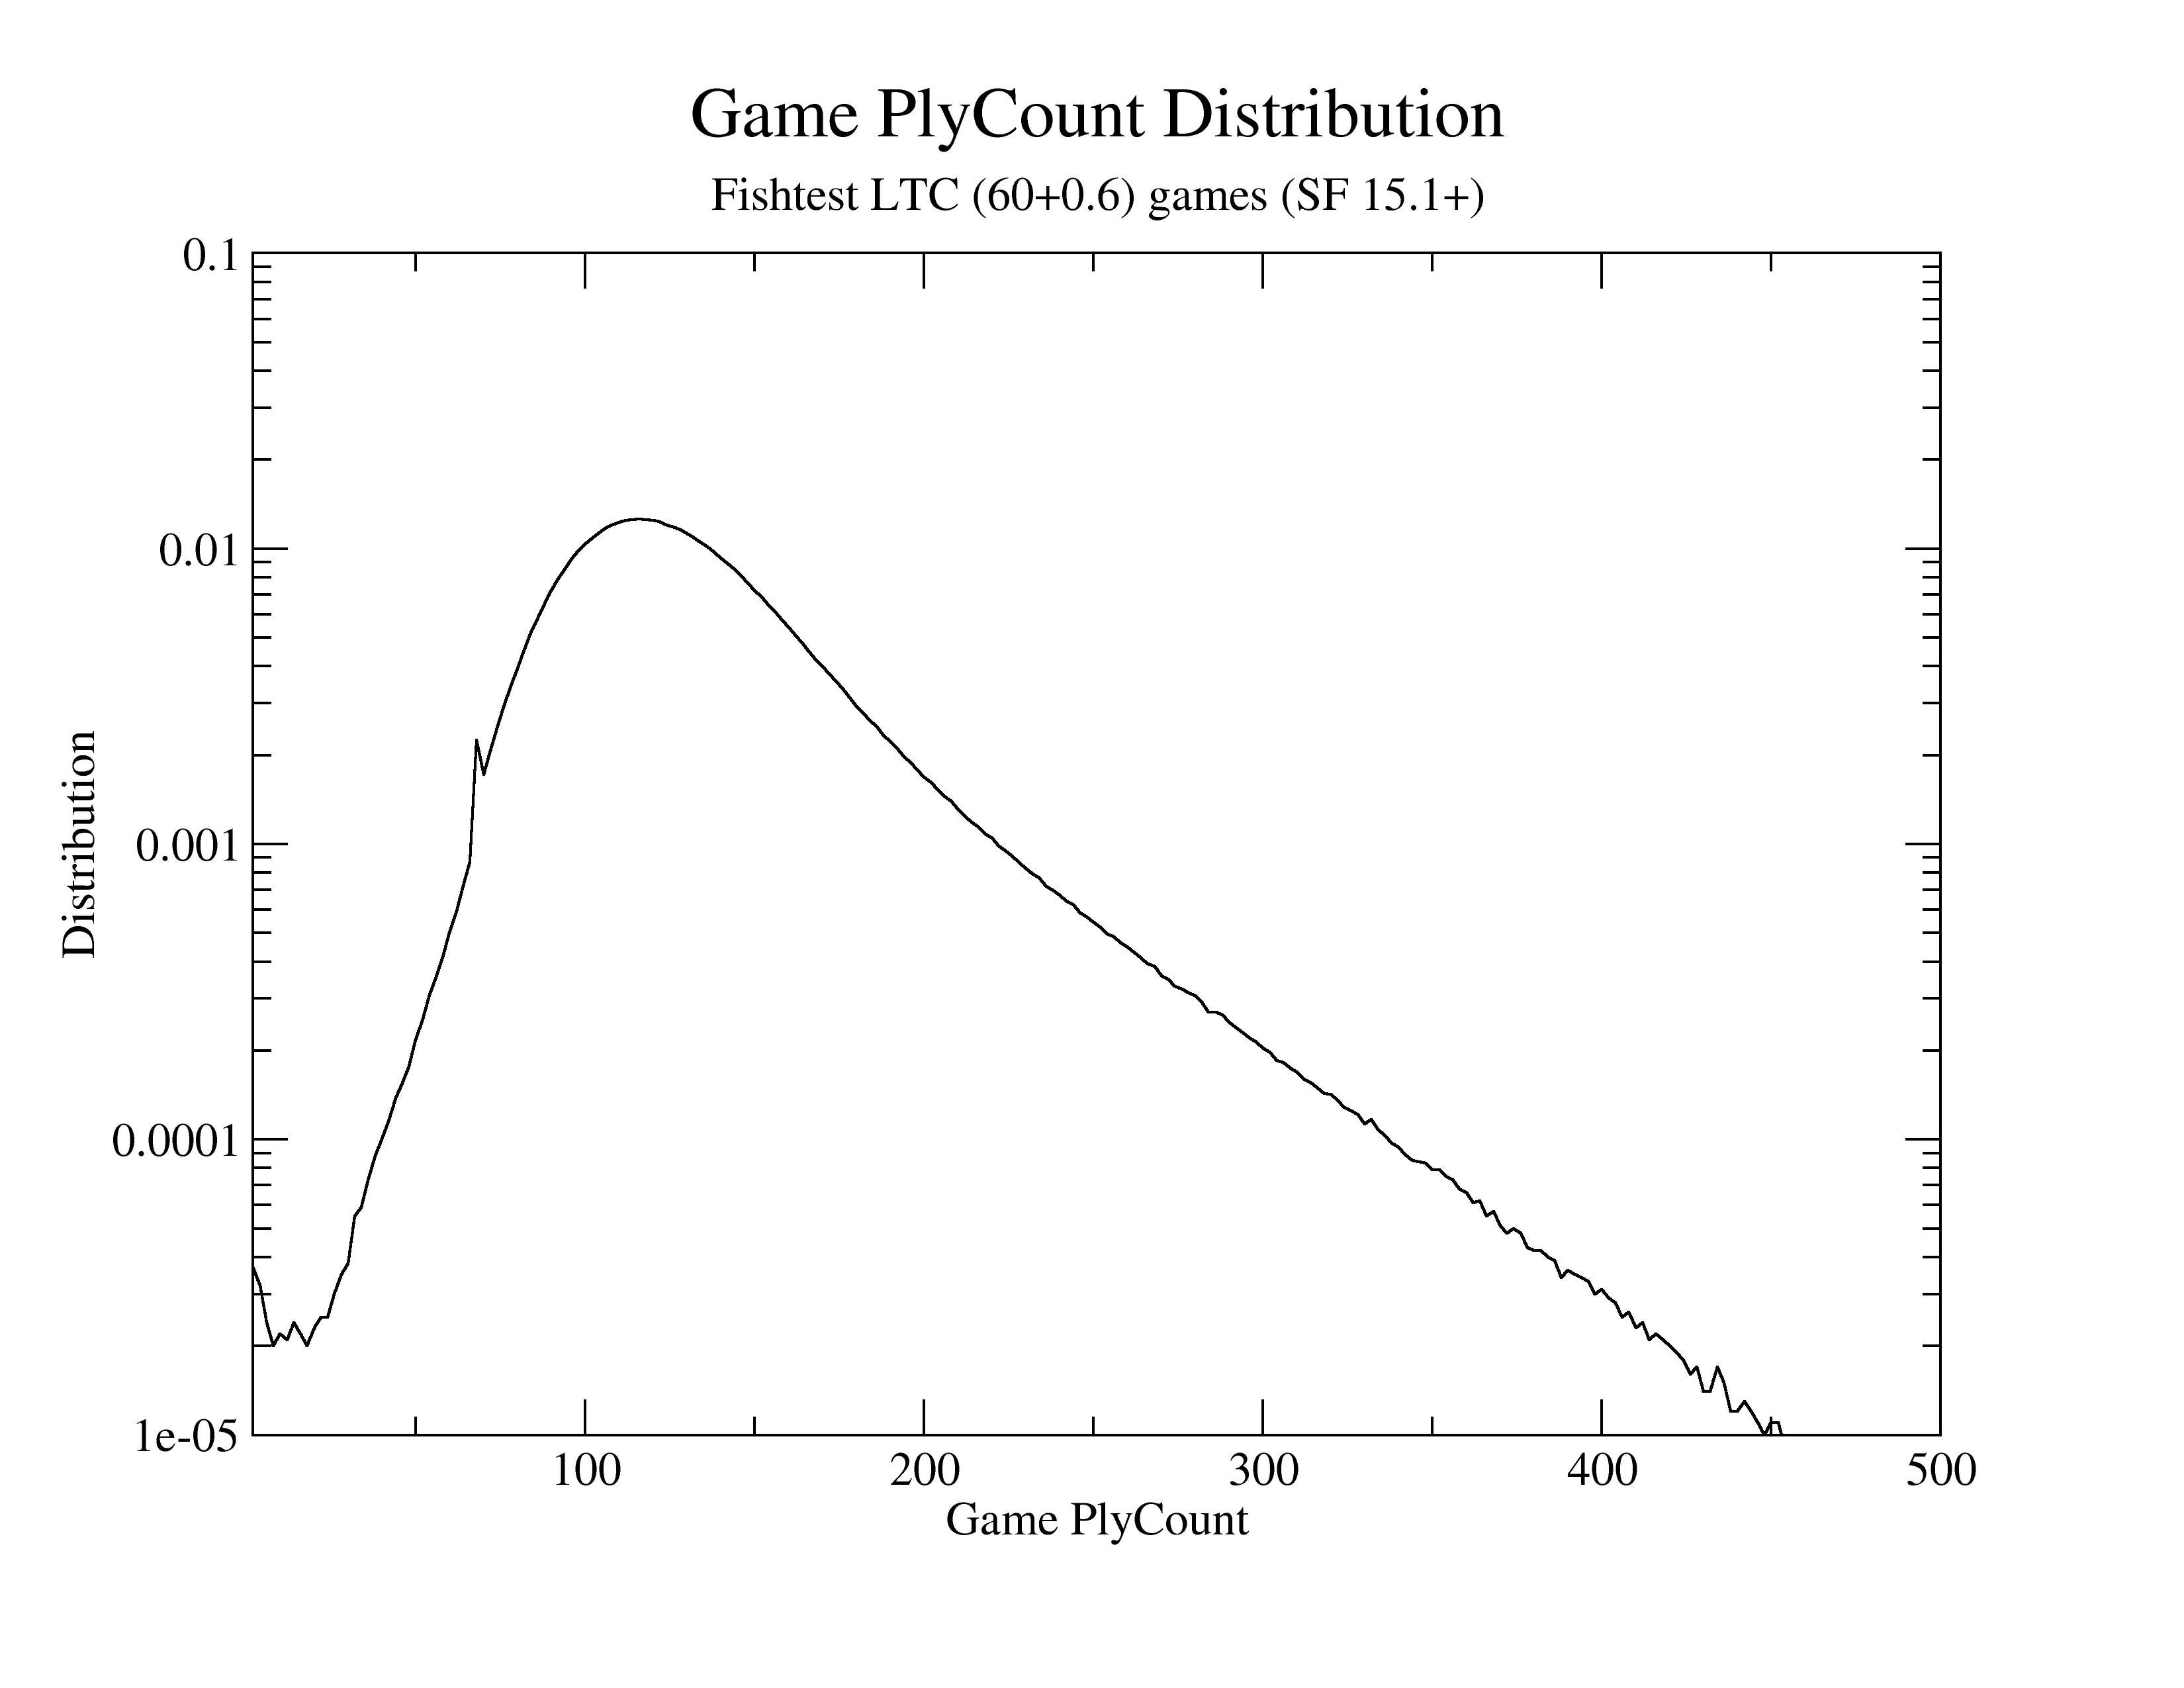
Distribution of lengths of games at LTC (60+0.6) on fishtest
In a collection of a few million games, the longest was 902 plies.
Elo gain from depth increase
The following graph shows the Elo gain between SF playing at depth N vs depth N - 1.
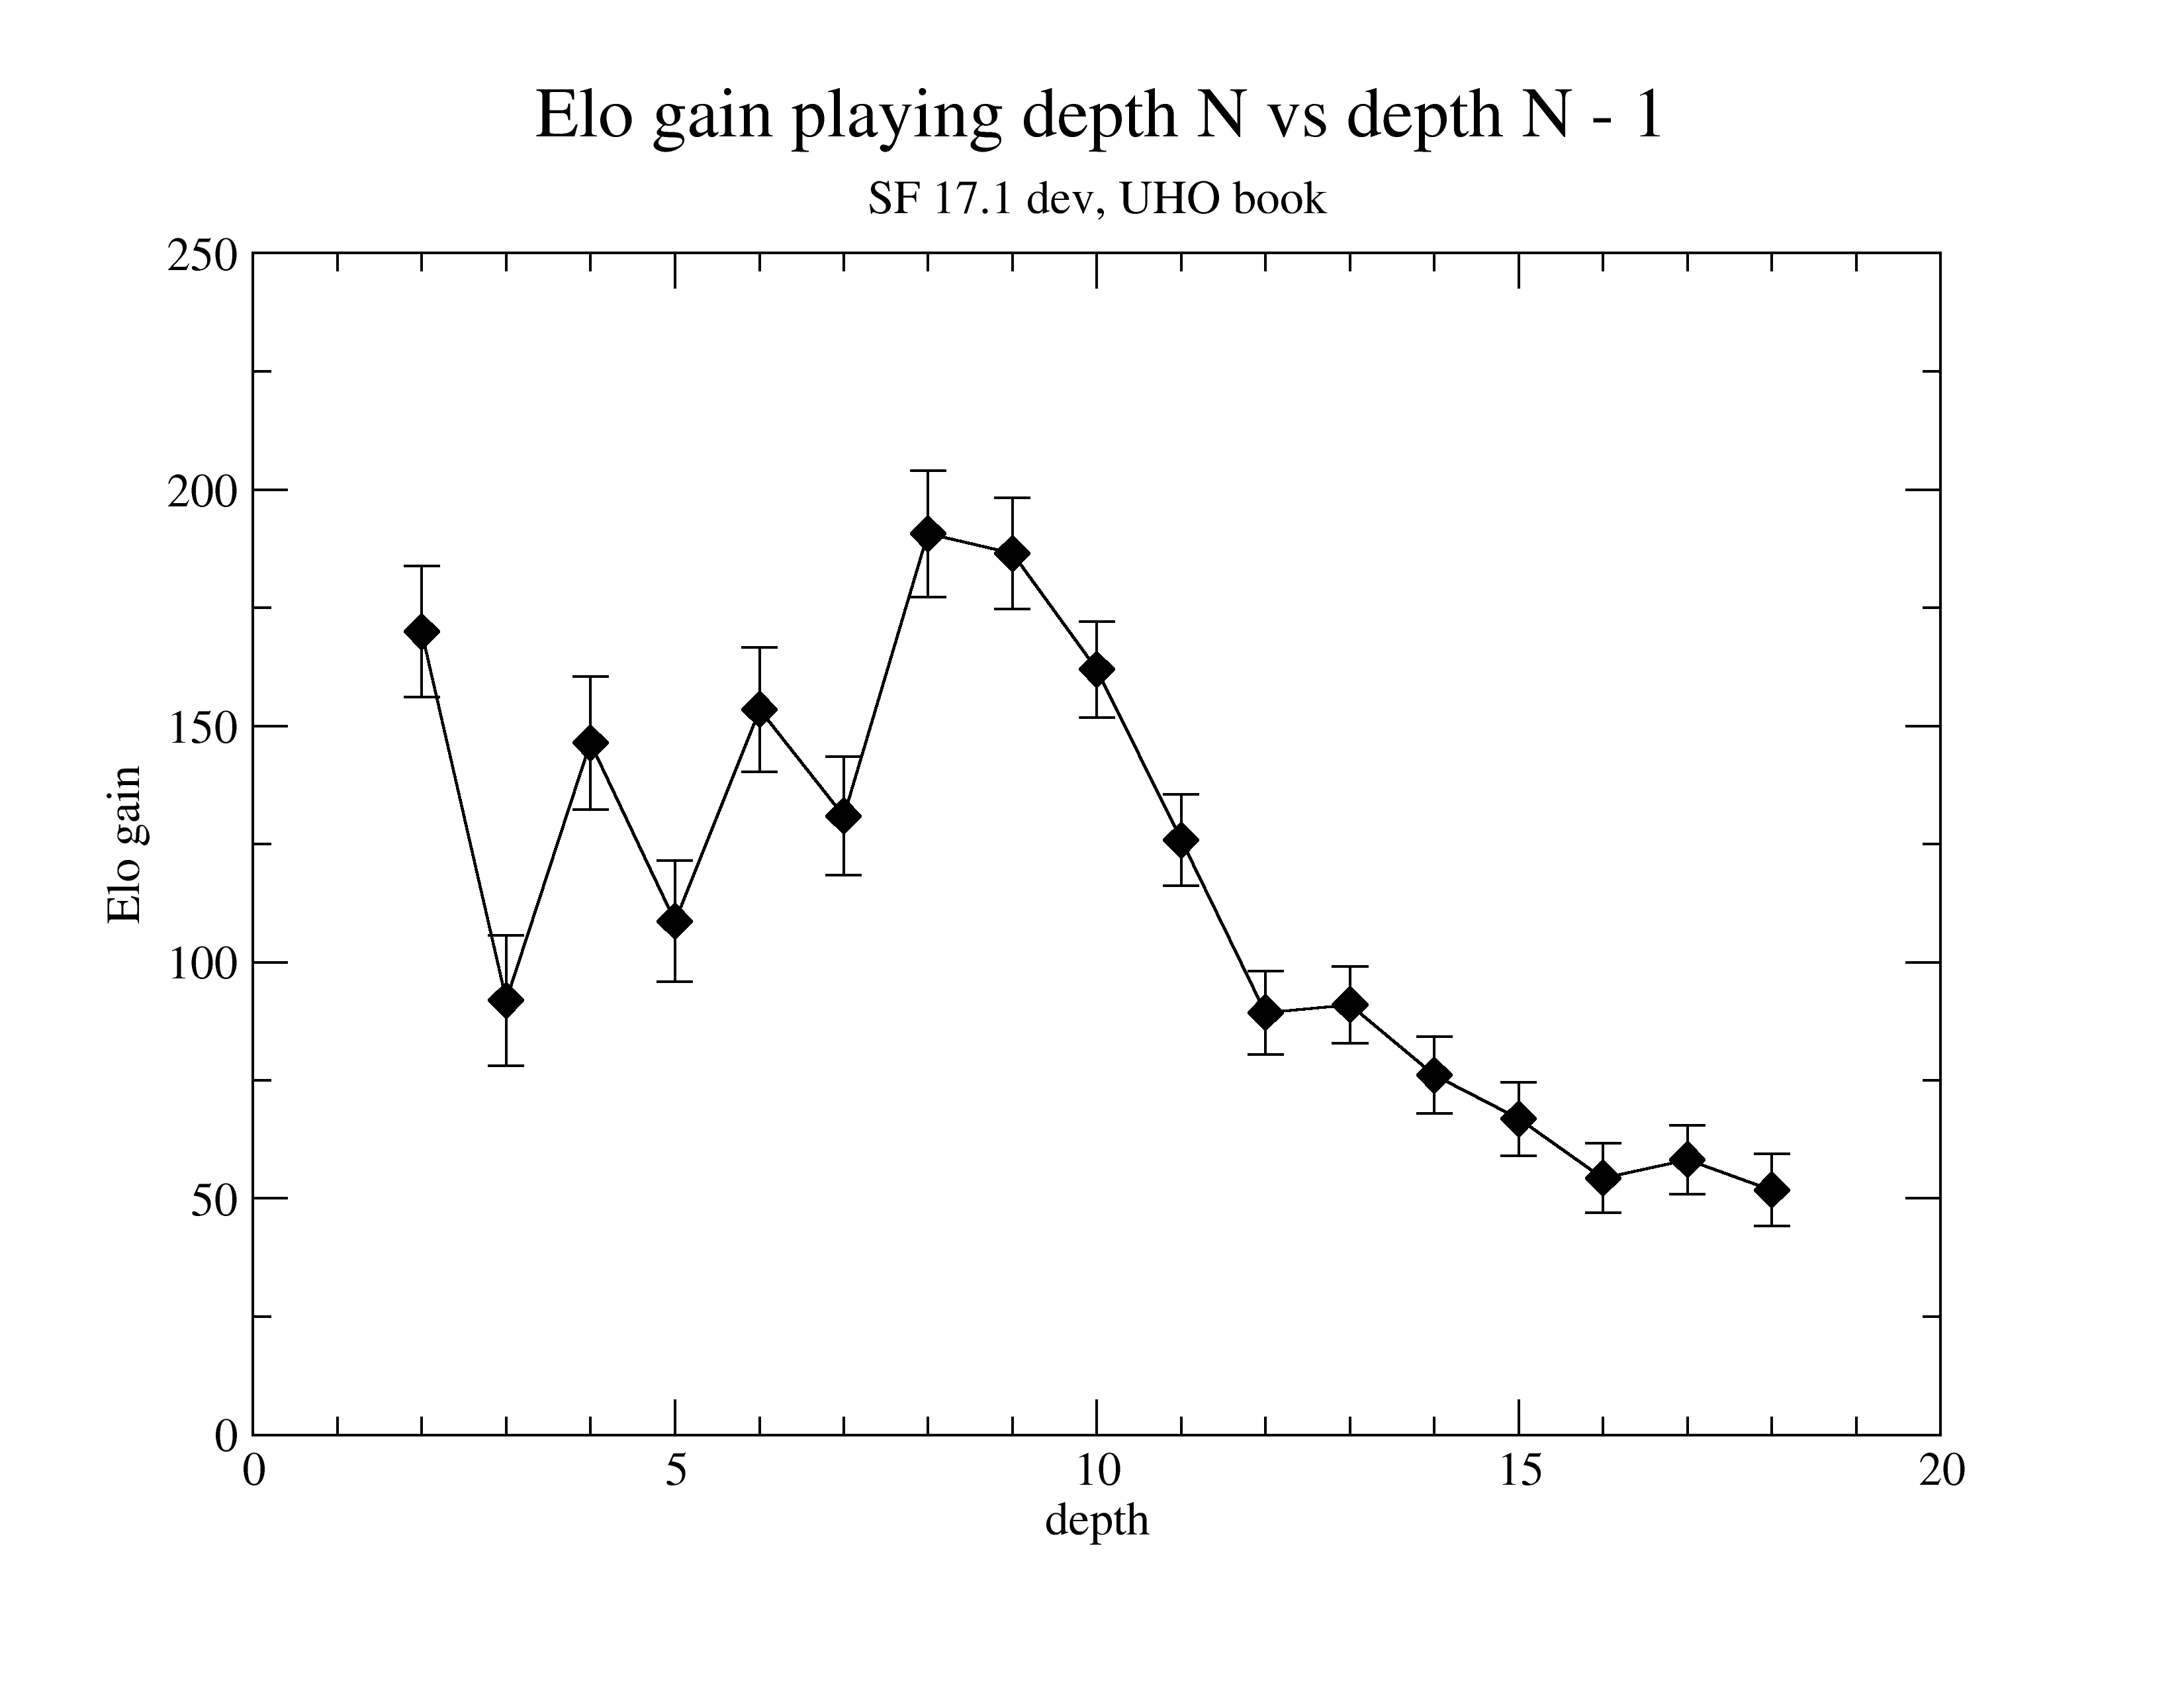
Raw data for the above graph
depth:  2  vs.  1  Result:  Elo: 169.93 +/- 13.84, nElo: 218.46 +/- 15.23
depth:  3  vs.  2  Result:  Elo: 91.90 +/- 13.84, nElo: 105.93 +/- 15.23
depth:  4  vs.  3  Result:  Elo: 146.36 +/- 14.02, nElo: 178.64 +/- 15.23
depth:  5  vs.  4  Result:  Elo: 108.68 +/- 12.87, nElo: 137.24 +/- 15.23
depth:  6  vs.  5  Result:  Elo: 153.44 +/- 13.18, nElo: 201.40 +/- 15.23
depth:  7  vs.  6  Result:  Elo: 130.94 +/- 12.55, nElo: 174.49 +/- 15.23
depth:  8  vs.  7  Result:  Elo: 190.62 +/- 13.42, nElo: 262.67 +/- 15.23
depth:  9  vs.  8  Result:  Elo: 186.48 +/- 11.82, nElo: 289.17 +/- 15.23
depth:  10  vs.  9  Result:  Elo: 161.92 +/- 10.20, nElo: 278.47 +/- 15.23
depth:  11  vs.  10  Result:  Elo: 125.78 +/- 9.66, nElo: 216.12 +/- 15.23
depth:  12  vs.  11  Result:  Elo: 89.30 +/- 8.83, nElo: 160.88 +/- 15.23
depth:  13  vs.  12  Result:  Elo: 90.97 +/- 8.18, nElo: 177.21 +/- 15.23
depth:  14  vs.  13  Result:  Elo: 76.06 +/- 8.12, nElo: 147.23 +/- 15.23
depth:  15  vs.  14  Result:  Elo: 66.82 +/- 7.79, nElo: 133.97 +/- 15.23
depth:  16  vs.  15  Result:  Elo: 54.29 +/- 7.35, nElo: 114.31 +/- 15.23
depth:  17  vs.  16  Result:  Elo: 58.21 +/- 7.24, nElo: 124.71 +/- 15.23
depth:  18  vs.  17  Result:  Elo: 51.80 +/- 7.60, nElo: 105.36 +/- 15.23
Win-Draw-Loss statistics of LTC games on fishtest
The following graph gives information on the Win-Draw-Loss (WDL) statistics, relating them to score and material count. It answers the question 'What fraction of positions that have a given score (and material count) in fishtest LTC, have a Win or a Draw or a Loss ?'.
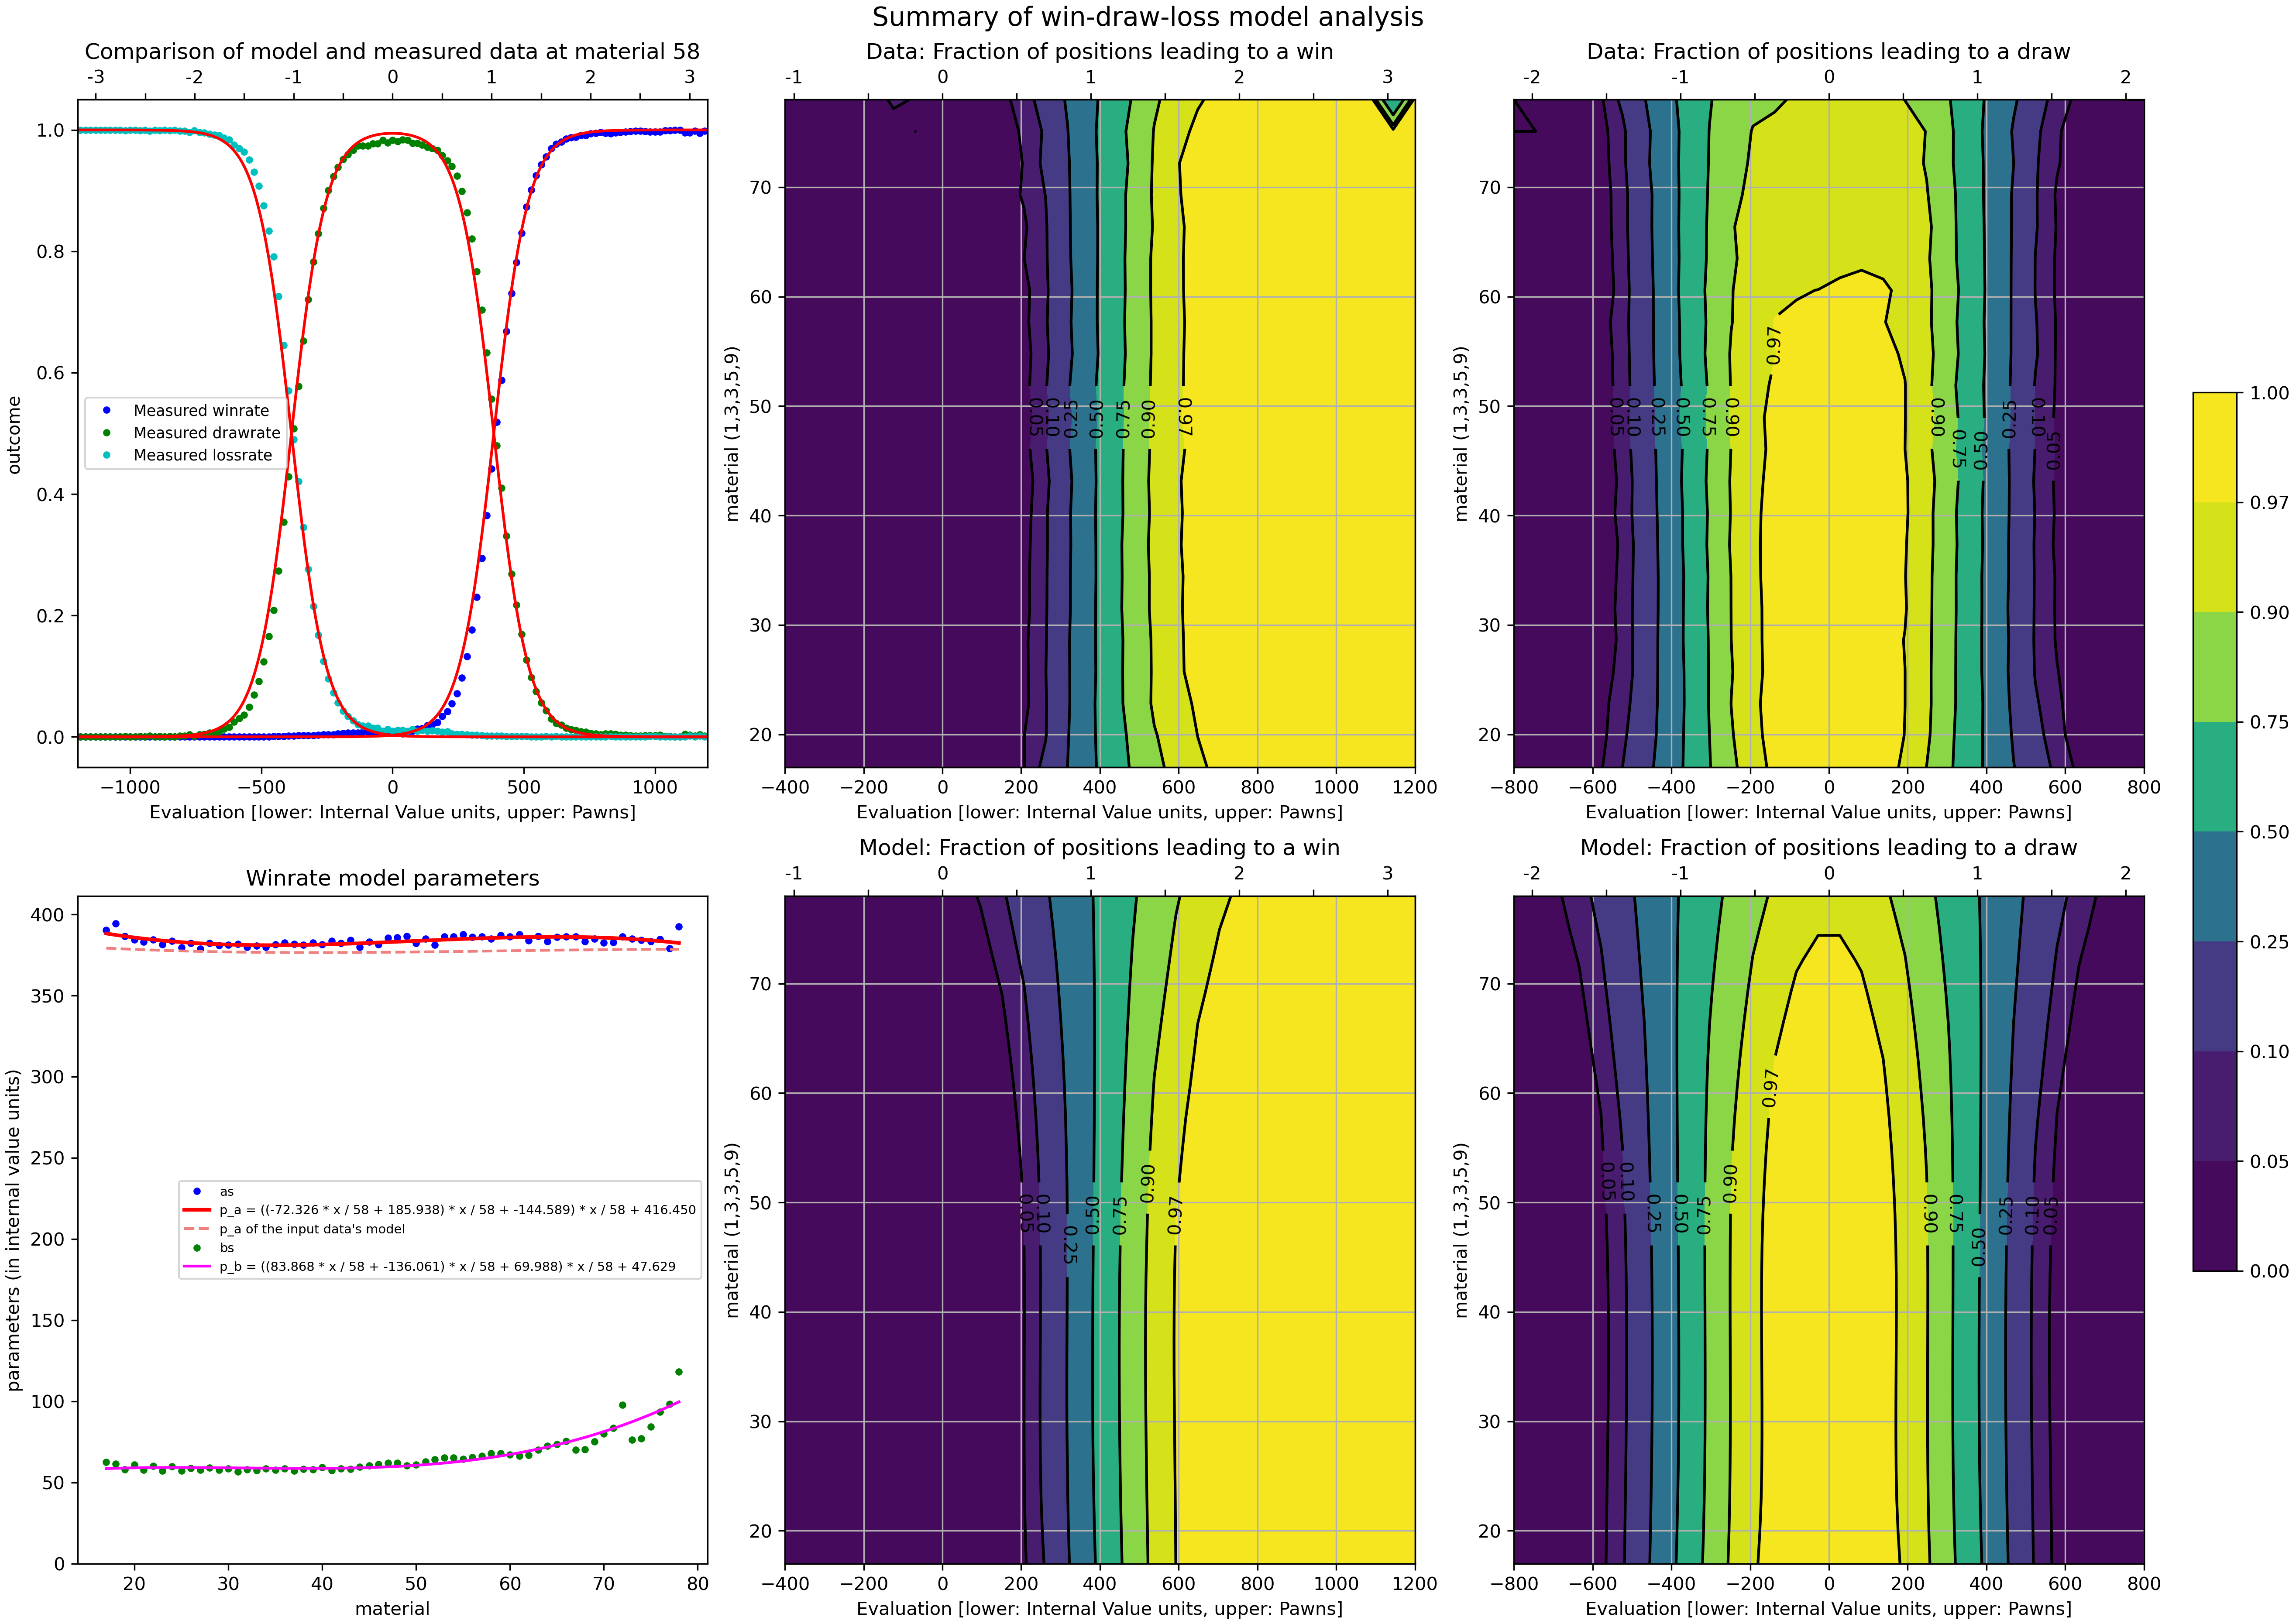
This model is used when Stockfish provides WDL statistics during analysis with the UCI_ShowWDL option set to True, as well as for the normalization of Stockfish's evaluation that ensures that a score of "100 centipawns" means the engine has a 50% probability to win from this position in selfplay at fishtest LTC time control. For details see the WDL model repo.
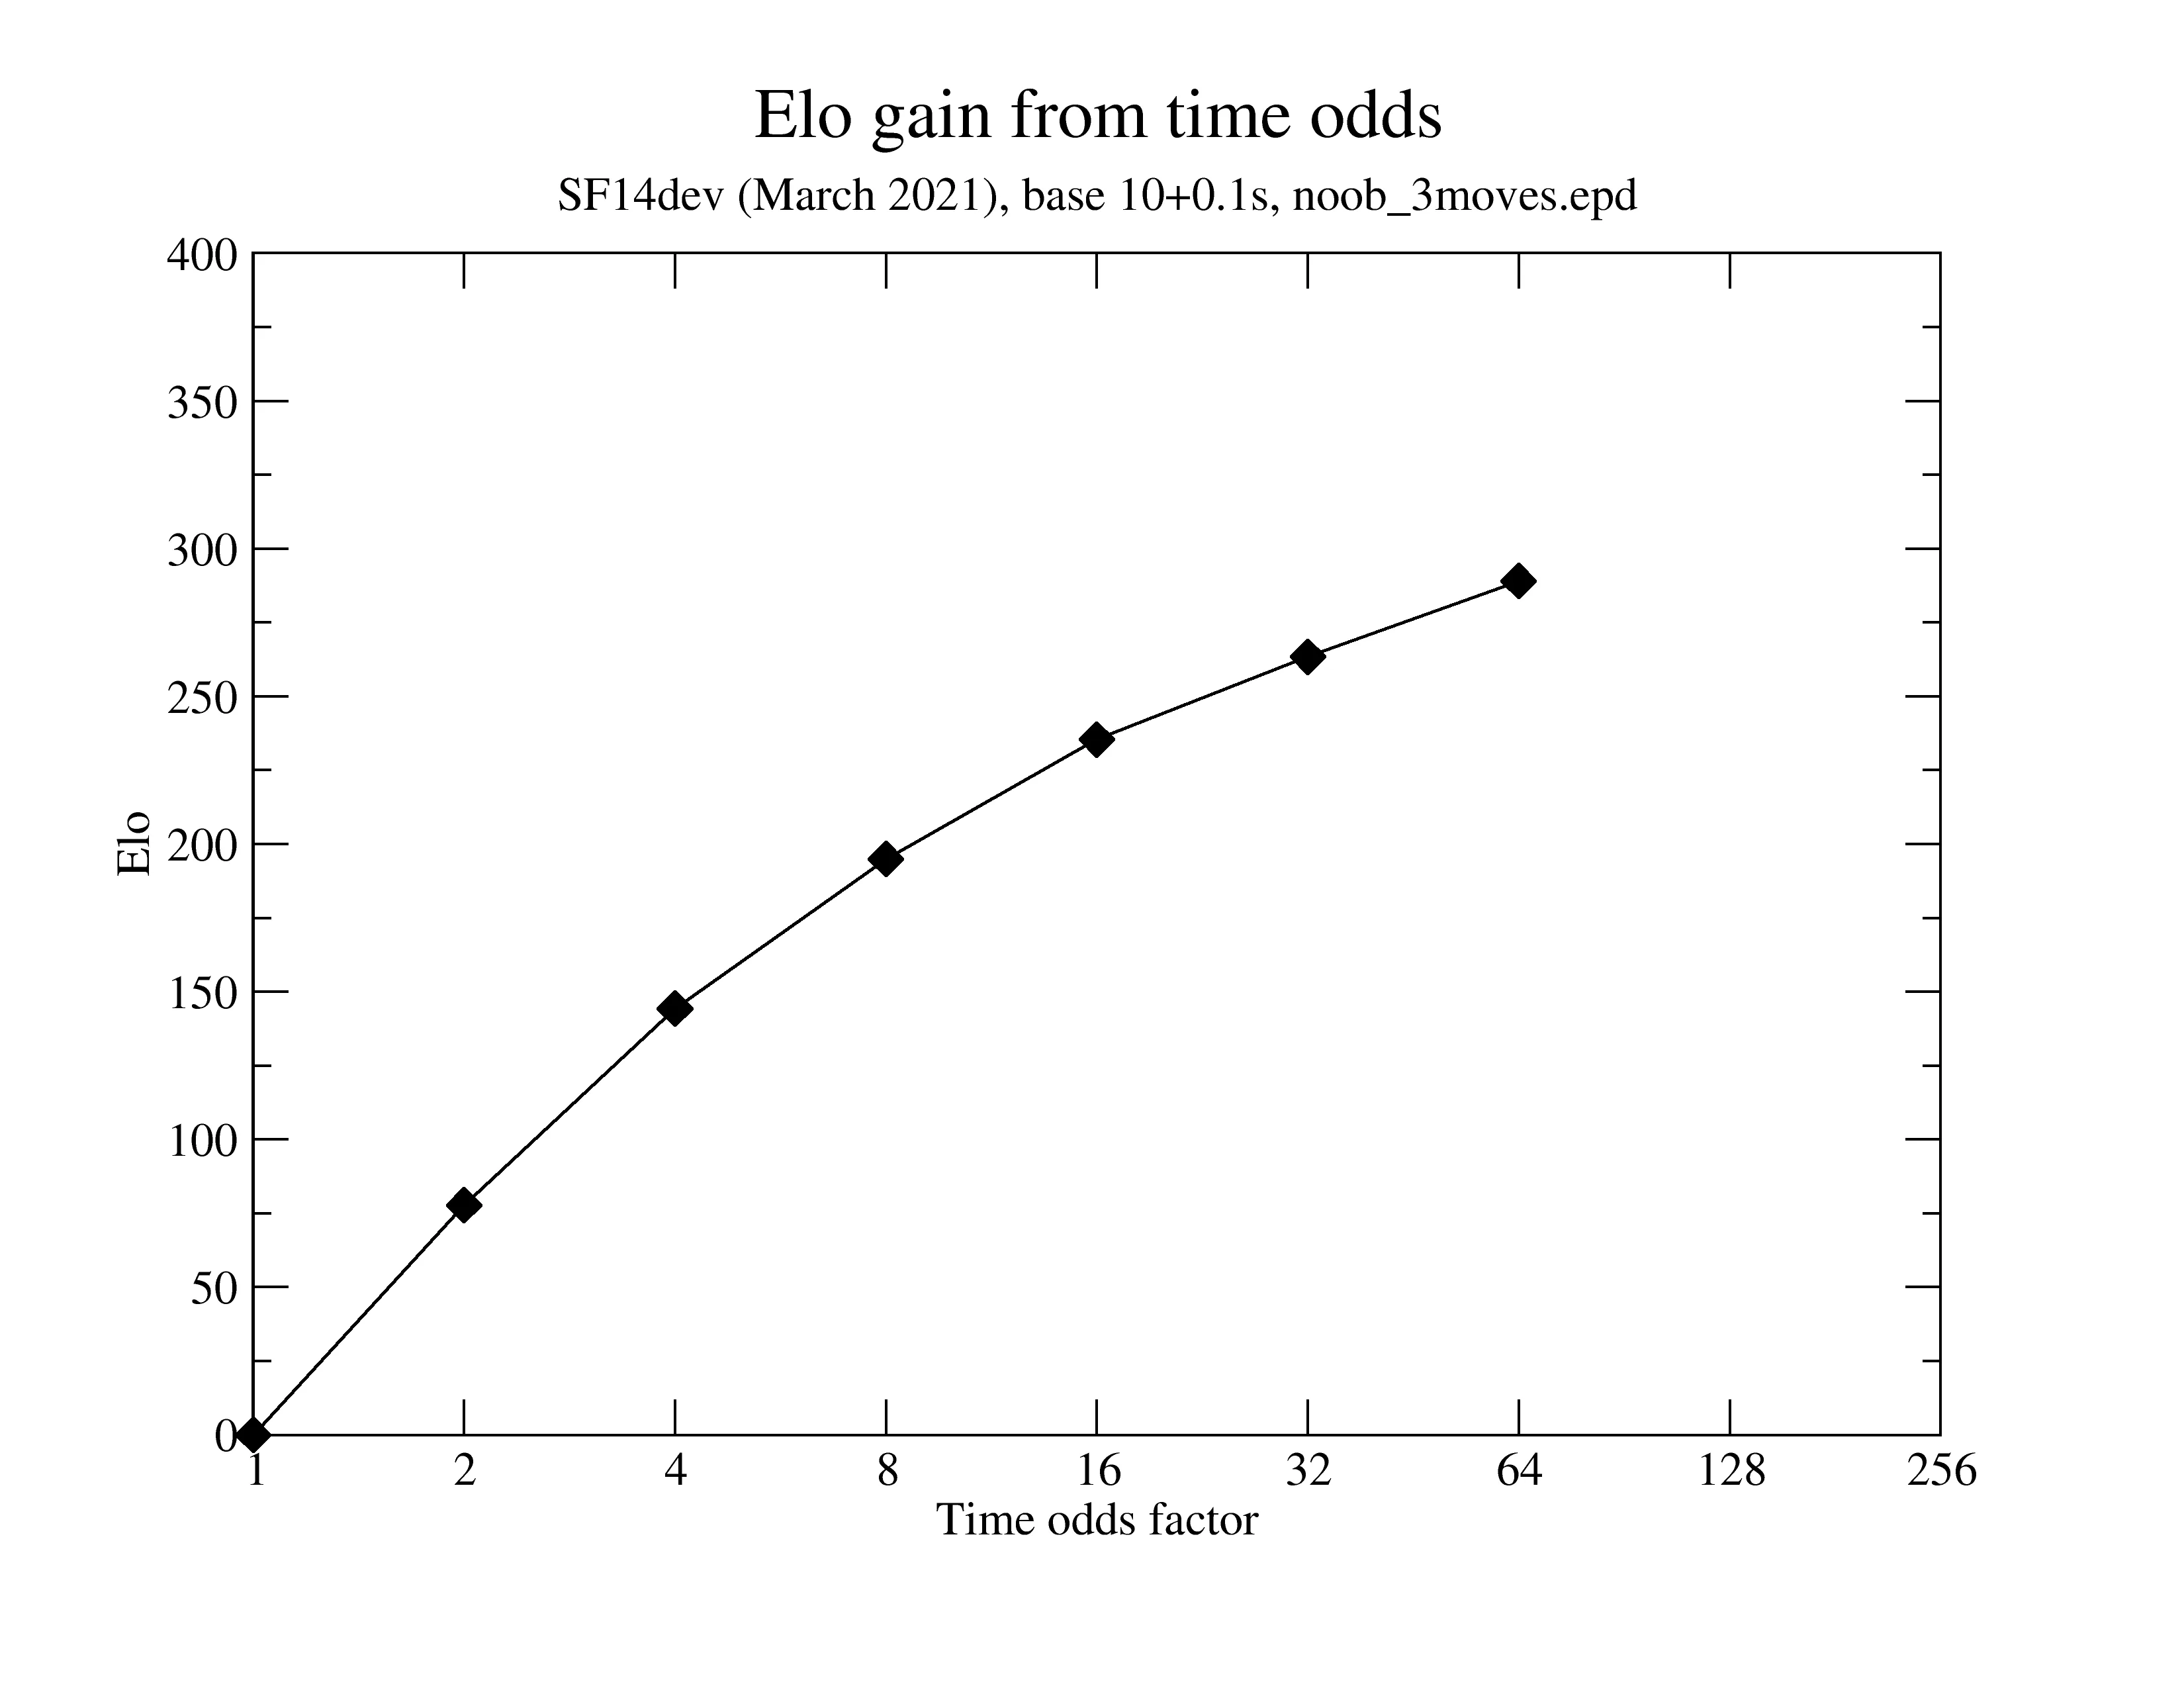
Equivalent time odds and normalized game pair Elo
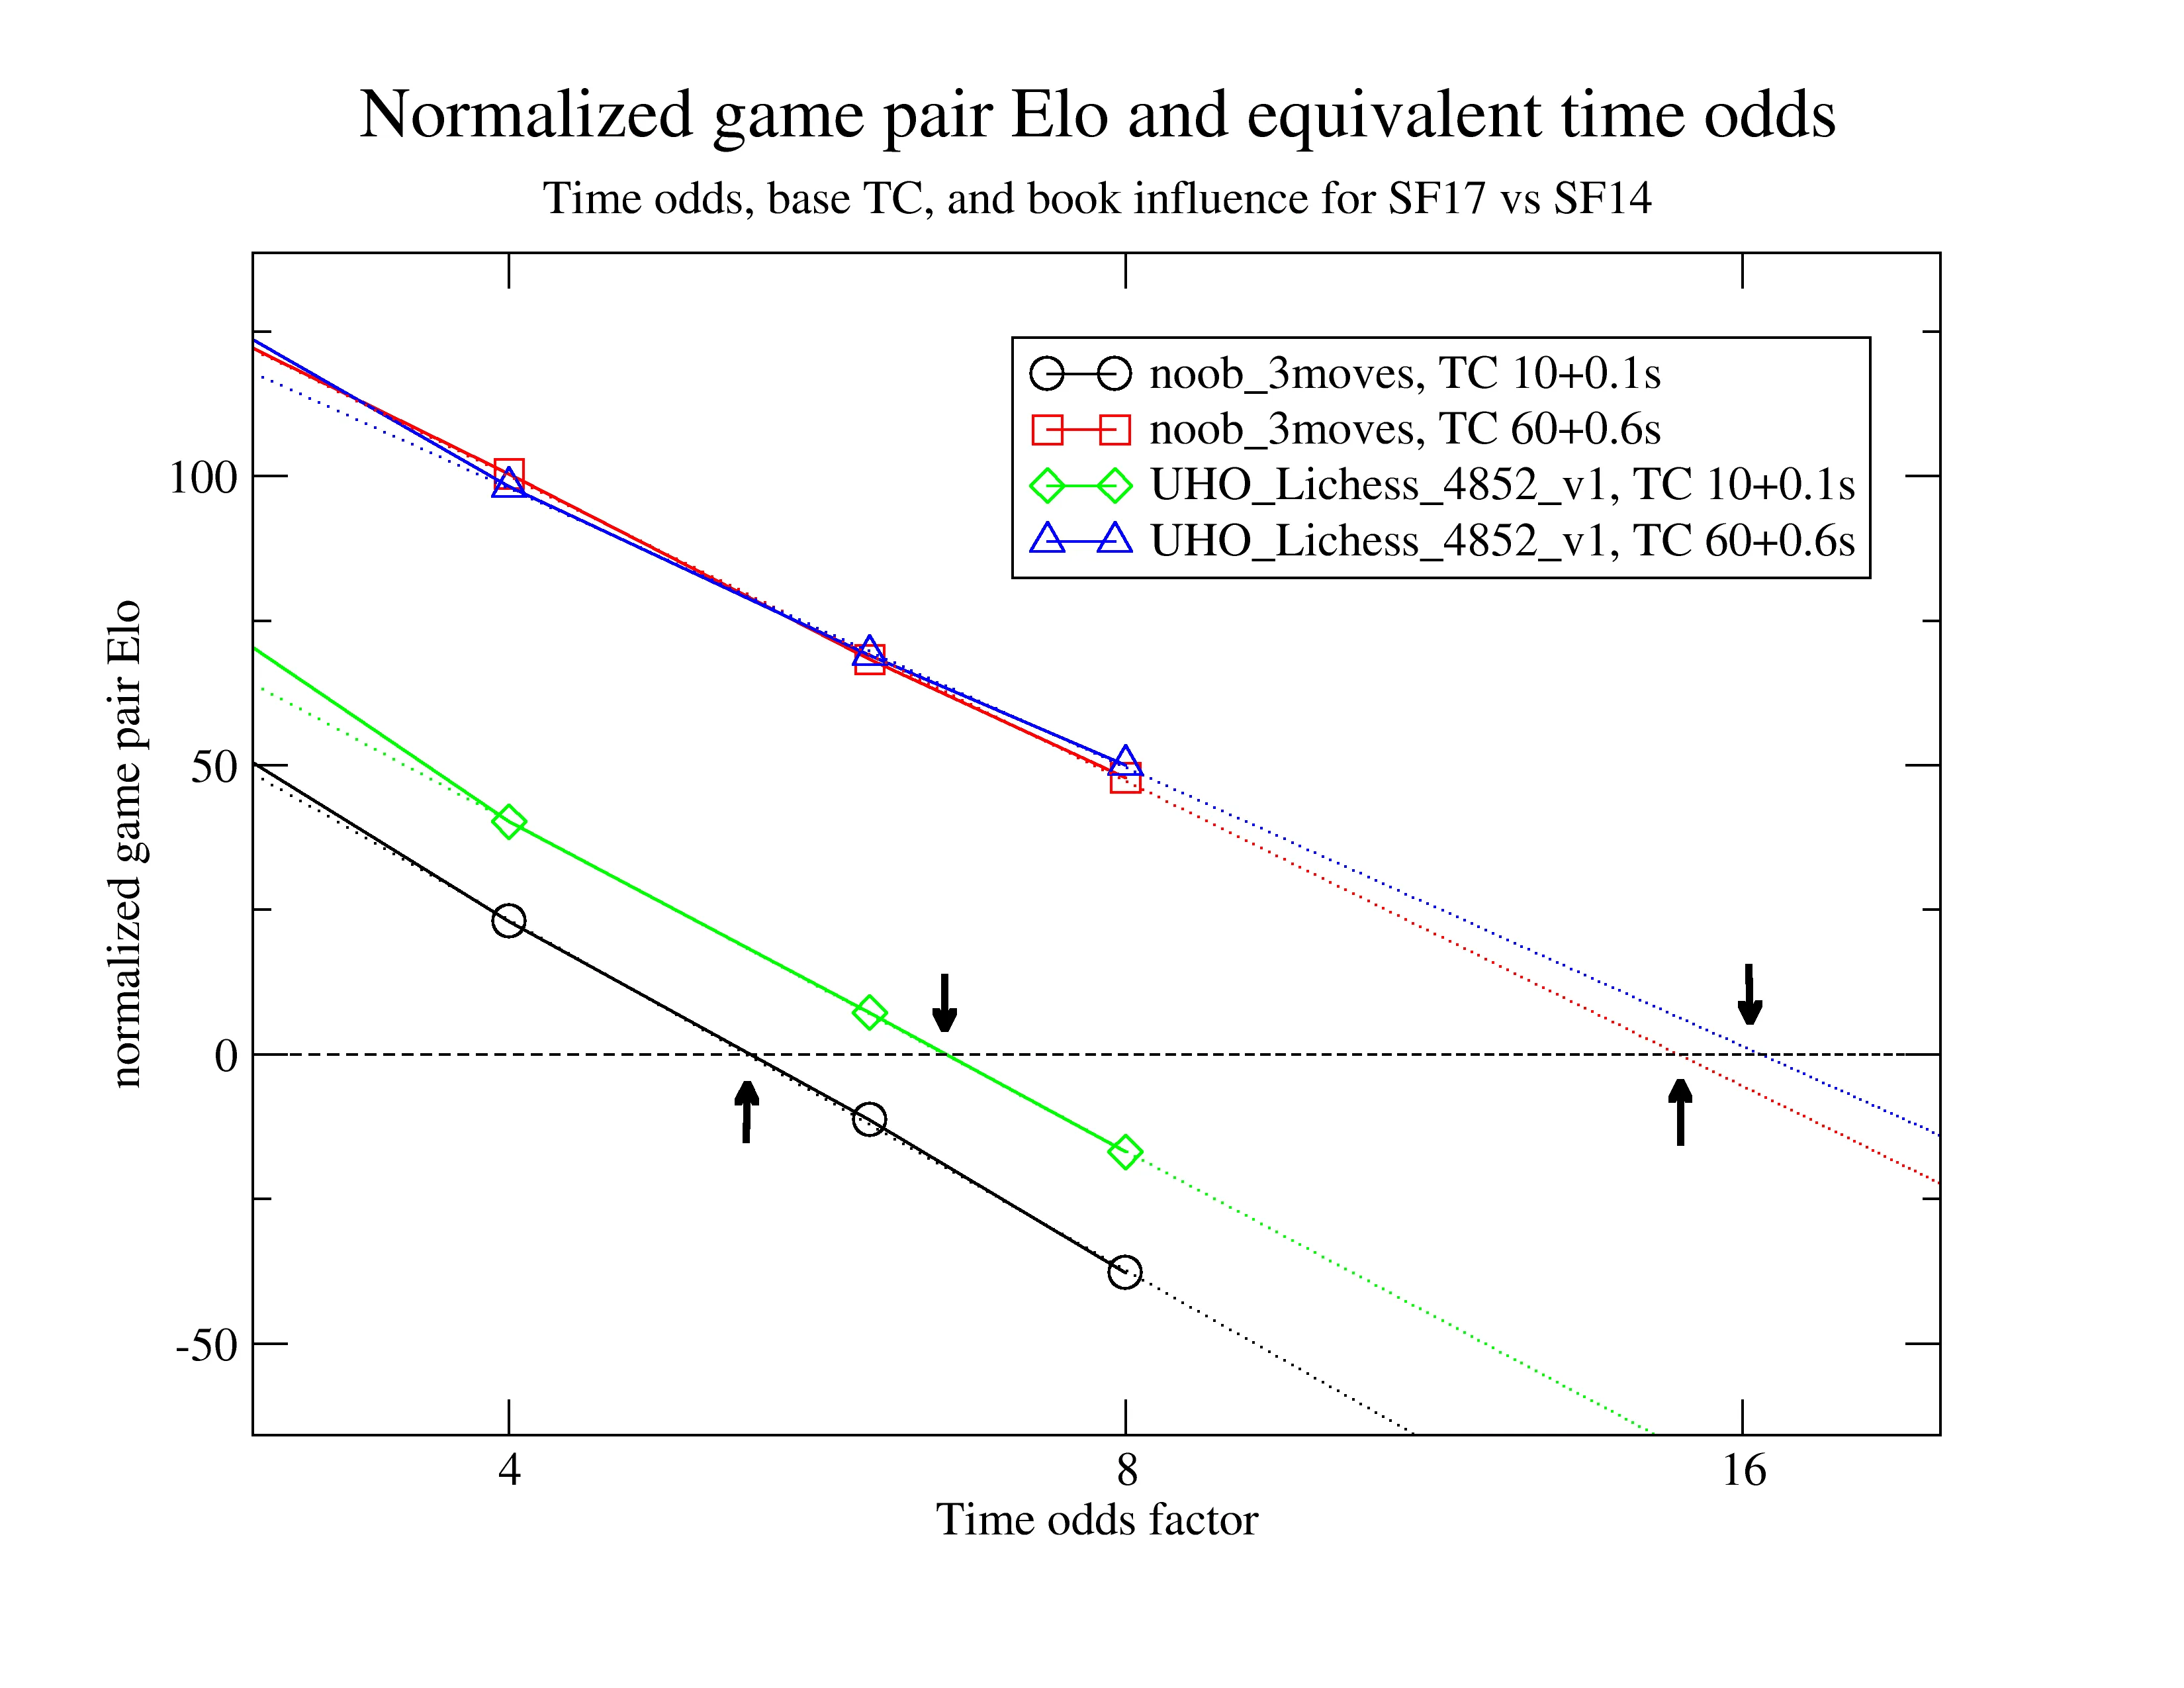
A suitable measure to define the Elo difference between two engines is normalized game pair Elo as defined from the pentanomial statistics by:
def normalized_game_pair_elo(row):
    return -100 * np.log10((2 * row['pntl0'] + row['pntl1']) / (2 * row['pntl4'] + row['pntl3']))
It is nearly book independent, and thus a good measure of relative strength of two engines at a given TC. To express more clearly what a given strength difference implies. We use 'equivalent time odds', i.e. the TC factor needed to have equivalent strength, i.e. zero Elo difference in a match between two engines (which is independent of the definition of Elo used).
We see that at STC the equivalent time odds is about 6x for SF14 vs SF17, while at LTC this time odds factor has become 16x.
Raw data for the above graph
======================================= UHO_Lichess_4852_v1 =======================================
engine1 tc1 engine2 tc2 elo pntl0 pntl1 pntl2 pntl3 pntl4 ngp_Elo
sf17 10+0.1 sf14 10.0+0.1 165.29 10 432 6509 25598 3291 185.24
sf17 10+0.1 sf14 40.0+0.4 41.74 251 5110 16632 13516 331 40.25
sf17 10+0.1 sf14 60.0+0.6 7.47 395 7724 17826 9736 159 7.22
sf17 10+0.1 sf14 80.0+0.8 -17.52 569 10075 17691 7408 97 -16.88
======================================= noob_3moves =======================================
engine1 tc1 engine2 tc2 elo pntl0 pntl1 pntl2 pntl3 pntl4 ngp_Elo
sf17 10+0.1 sf14 10.0+0.1 108.47 6 610 16073 16012 3139 155.43
sf17 10+0.1 sf14 40.0+0.4 10.85 100 3004 27471 5089 176 23.00
sf17 10+0.1 sf14 60.0+0.6 -4.87 165 4048 28312 3257 58 -11.33
sf17 10+0.1 sf14 80.0+0.8 -15.02 219 4892 28520 2184 25 -37.76
======================================= UHO_Lichess_4852_v1 =======================================
engine1 tc1 engine2 tc2 elo pntl0 pntl1 pntl2 pntl3 pntl4 ngp_Elo
sf17 60+0.6 sf14 60.0+0.6 163.96 1 194 5269 29060 1316 220.87
sf17 60+0.6 sf14 240.0+2.4 88.09 25 2021 14134 19482 178 98.13
sf17 60+0.6 sf14 360.0+3.6 63.06 41 3212 16546 15938 103 69.03
sf17 60+0.6 sf14 480.0+4.8 46.39 72 4243 17703 13760 62 50.03
======================================= noob_3moves =======================================
engine1 tc1 engine2 tc2 elo pntl0 pntl1 pntl2 pntl3 pntl4 ngp_Elo
sf17 60+0.6 sf14 60.0+0.6 71.55 0 131 22234 12279 1196 204.92
sf17 60+0.6 sf14 240.0+2.4 19.23 0 436 31090 4231 83 100.37
sf17 60+0.6 sf14 360.0+3.6 11.51 3 616 32255 2938 28 68.25
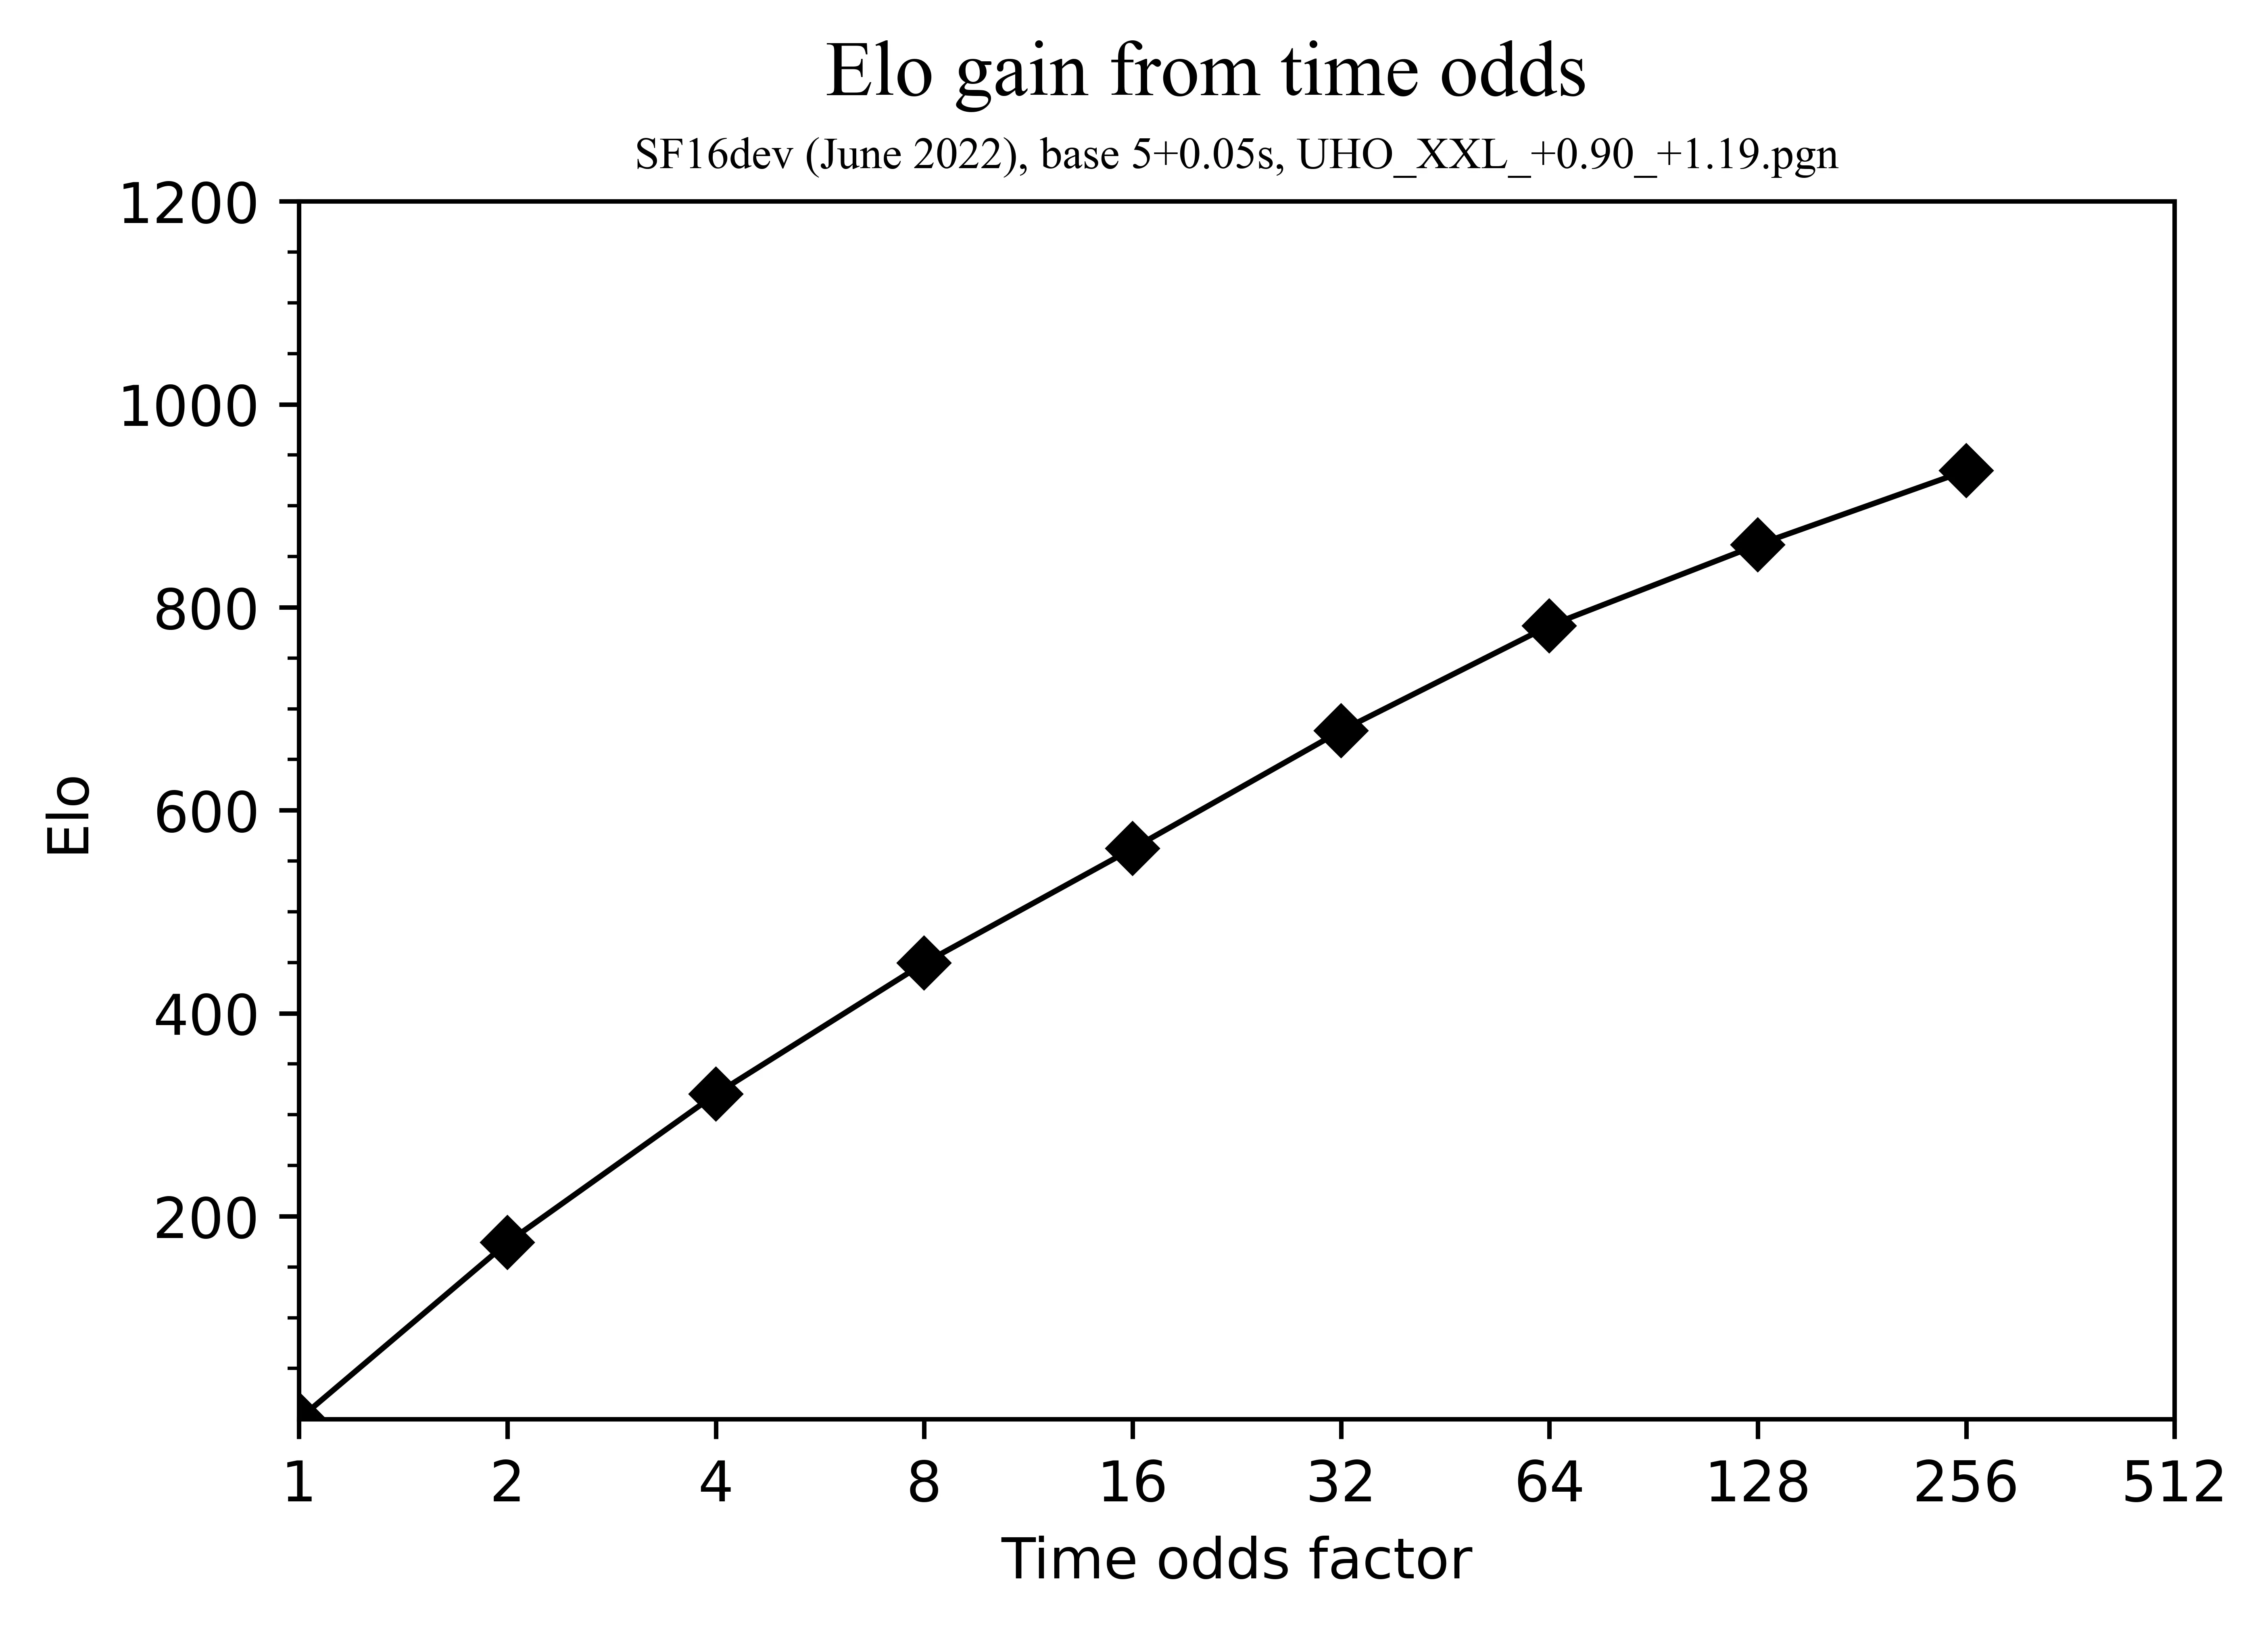
sf17 60+0.6 sf14 480.0+4.8 7.08 6 716 32949 2149 20 47.81Elo gain with time odds
See also: https://github.com/official-stockfish/Stockfish/discussions/3402
comparing 20% time odds across versions
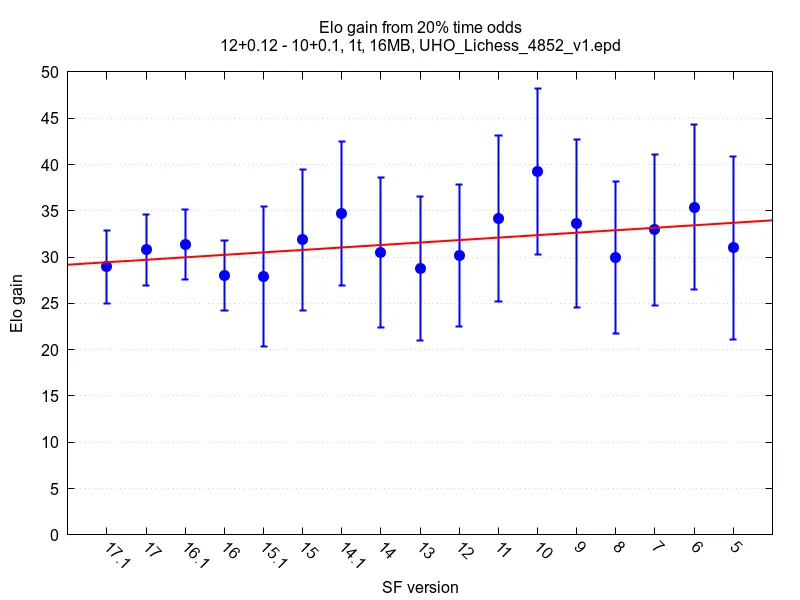
Raw data for the above graph
sf17.1 Elo: 28.95 +/- 3.95, nElo: 56.12 +/- 7.61 LOS: 100.00 %, DrawRatio: 48.77 %, PairsRatio: 1.88 Games: 8000, Wins: 2396, Losses: 1731, Draws: 3873, Points: 4332.5 (54.16 %) Ptnml(0-2): [10, 702, 1951, 1287, 50], WL/DD Ratio: 1.07
sf17 Elo: 30.78 +/- 3.85, nElo: 61.16 +/- 7.61 LOS: 100.00 %, DrawRatio: 50.60 %, PairsRatio: 2.04 Games: 8000, Wins: 2410, Losses: 1703, Draws: 3887, Points: 4353.5 (54.42 %) Ptnml(0-2): [13, 636, 2024, 1285, 42], WL/DD Ratio: 1.06
sf16.1 Elo: 31.35 +/- 3.81, nElo: 63.07 +/- 7.61 LOS: 100.00 %, DrawRatio: 50.98 %, PairsRatio: 2.12 Games: 8000, Wins: 2438, Losses: 1718, Draws: 3844, Points: 4360.0 (54.50 %) Ptnml(0-2): [15, 613, 2039, 1303, 30], WL/DD Ratio: 1.12
sf16 Elo: 28.03 +/- 3.81, nElo: 56.30 +/- 7.61 LOS: 100.00 %, DrawRatio: 51.12 %, PairsRatio: 1.94 Games: 8000, Wins: 2357, Losses: 1713, Draws: 3930, Points: 4322.0 (54.02 %) Ptnml(0-2): [11, 654, 2045, 1260, 30], WL/DD Ratio: 1.03
sf15.1 Elo: 27.85 +/- 7.56, nElo: 56.36 +/- 15.23 LOS: 100.00 %, DrawRatio: 52.40 %, PairsRatio: 1.99 Games: 2000, Wins: 583, Losses: 423, Draws: 994, Points: 1080.0 (54.00 %) Ptnml(0-2): [5, 154, 524, 310, 7], WL/DD Ratio: 0.98
sf15 Elo: 31.88 +/- 7.60, nElo: 64.26 +/- 15.23 LOS: 100.00 %, DrawRatio: 51.30 %, PairsRatio: 2.10 Games: 2000, Wins: 590, Losses: 407, Draws: 1003, Points: 1091.5 (54.57 %) Ptnml(0-2): [1, 156, 513, 319, 11], WL/DD Ratio: 0.94
sf14.1 Elo: 34.68 +/- 7.76, nElo: 68.50 +/- 15.23 LOS: 100.00 %, DrawRatio: 49.00 %, PairsRatio: 2.17 Games: 2000, Wins: 591, Losses: 392, Draws: 1017, Points: 1099.5 (54.97 %) Ptnml(0-2): [1, 160, 490, 337, 12], WL/DD Ratio: 0.88
sf14 Elo: 30.48 +/- 8.12, nElo: 57.43 +/- 15.23 LOS: 100.00 %, DrawRatio: 48.10 %, PairsRatio: 1.93 Games: 2000, Wins: 597, Losses: 422, Draws: 981, Points: 1087.5 (54.37 %) Ptnml(0-2): [7, 170, 481, 325, 17], WL/DD Ratio: 0.98
sf13 Elo: 28.73 +/- 7.76, nElo: 56.66 +/- 15.23 LOS: 100.00 %, DrawRatio: 51.80 %, PairsRatio: 1.92 Games: 2000, Wins: 576, Losses: 411, Draws: 1013, Points: 1082.5 (54.12 %) Ptnml(0-2): [3, 162, 518, 301, 16], WL/DD Ratio: 0.88
sf12 Elo: 30.13 +/- 7.66, nElo: 60.16 +/- 15.23 LOS: 100.00 %, DrawRatio: 51.60 %, PairsRatio: 2.01 Games: 2000, Wins: 584, Losses: 411, Draws: 1005, Points: 1086.5 (54.33 %) Ptnml(0-2): [2, 159, 516, 310, 13], WL/DD Ratio: 0.93
sf11 Elo: 34.16 +/- 8.99, nElo: 58.24 +/- 15.23 LOS: 100.00 %, DrawRatio: 44.30 %, PairsRatio: 1.89 Games: 2000, Wins: 631, Losses: 435, Draws: 934, Points: 1098.0 (54.90 %) Ptnml(0-2): [15, 178, 443, 324, 40], WL/DD Ratio: 1.05
sf10 Elo: 39.25 +/- 9.00, nElo: 67.01 +/- 15.23 LOS: 100.00 %, DrawRatio: 44.30 %, PairsRatio: 2.04 Games: 2000, Wins: 639, Losses: 414, Draws: 947, Points: 1112.5 (55.62 %) Ptnml(0-2): [12, 171, 443, 328, 46], WL/DD Ratio: 0.98
sf9 Elo: 33.63 +/- 9.03, nElo: 57.09 +/- 15.23 LOS: 100.00 %, DrawRatio: 45.30 %, PairsRatio: 1.82 Games: 2000, Wins: 637, Losses: 444, Draws: 919, Points: 1096.5 (54.83 %) Ptnml(0-2): [13, 181, 453, 306, 47], WL/DD Ratio: 1.10
sf8 Elo: 29.95 +/- 8.25, nElo: 55.56 +/- 15.23 LOS: 100.00 %, DrawRatio: 50.00 %, PairsRatio: 1.94 Games: 2000, Wins: 573, Losses: 401, Draws: 1026, Points: 1086.0 (54.30 %) Ptnml(0-2): [12, 158, 500, 306, 24], WL/DD Ratio: 0.78
sf7 Elo: 32.93 +/- 8.14, nElo: 61.98 +/- 15.23 LOS: 100.00 %, DrawRatio: 50.80 %, PairsRatio: 2.00 Games: 2000, Wins: 565, Losses: 376, Draws: 1059, Points: 1094.5 (54.73 %) Ptnml(0-2): [5, 159, 508, 298, 30], WL/DD Ratio: 0.69
sf6 Elo: 35.39 +/- 8.89, nElo: 61.03 +/- 15.23 LOS: 100.00 %, DrawRatio: 46.80 %, PairsRatio: 1.94 Games: 2000, Wins: 596, Losses: 393, Draws: 1011, Points: 1101.5 (55.07 %) Ptnml(0-2): [13, 168, 468, 305, 46], WL/DD Ratio: 0.74
sf5 Elo: 31.00 +/- 9.89, nElo: 47.99 +/- 15.23 LOS: 100.00 %, DrawRatio: 40.80 %, PairsRatio: 1.67 Games: 2000, Wins: 622, Losses: 444, Draws: 934, Points: 1089.0 (54.45 %) Ptnml(0-2): [30, 192, 408, 310, 60], WL/DD Ratio: 0.89
larger time odds
| New | Old |
|---|---|
 |  |
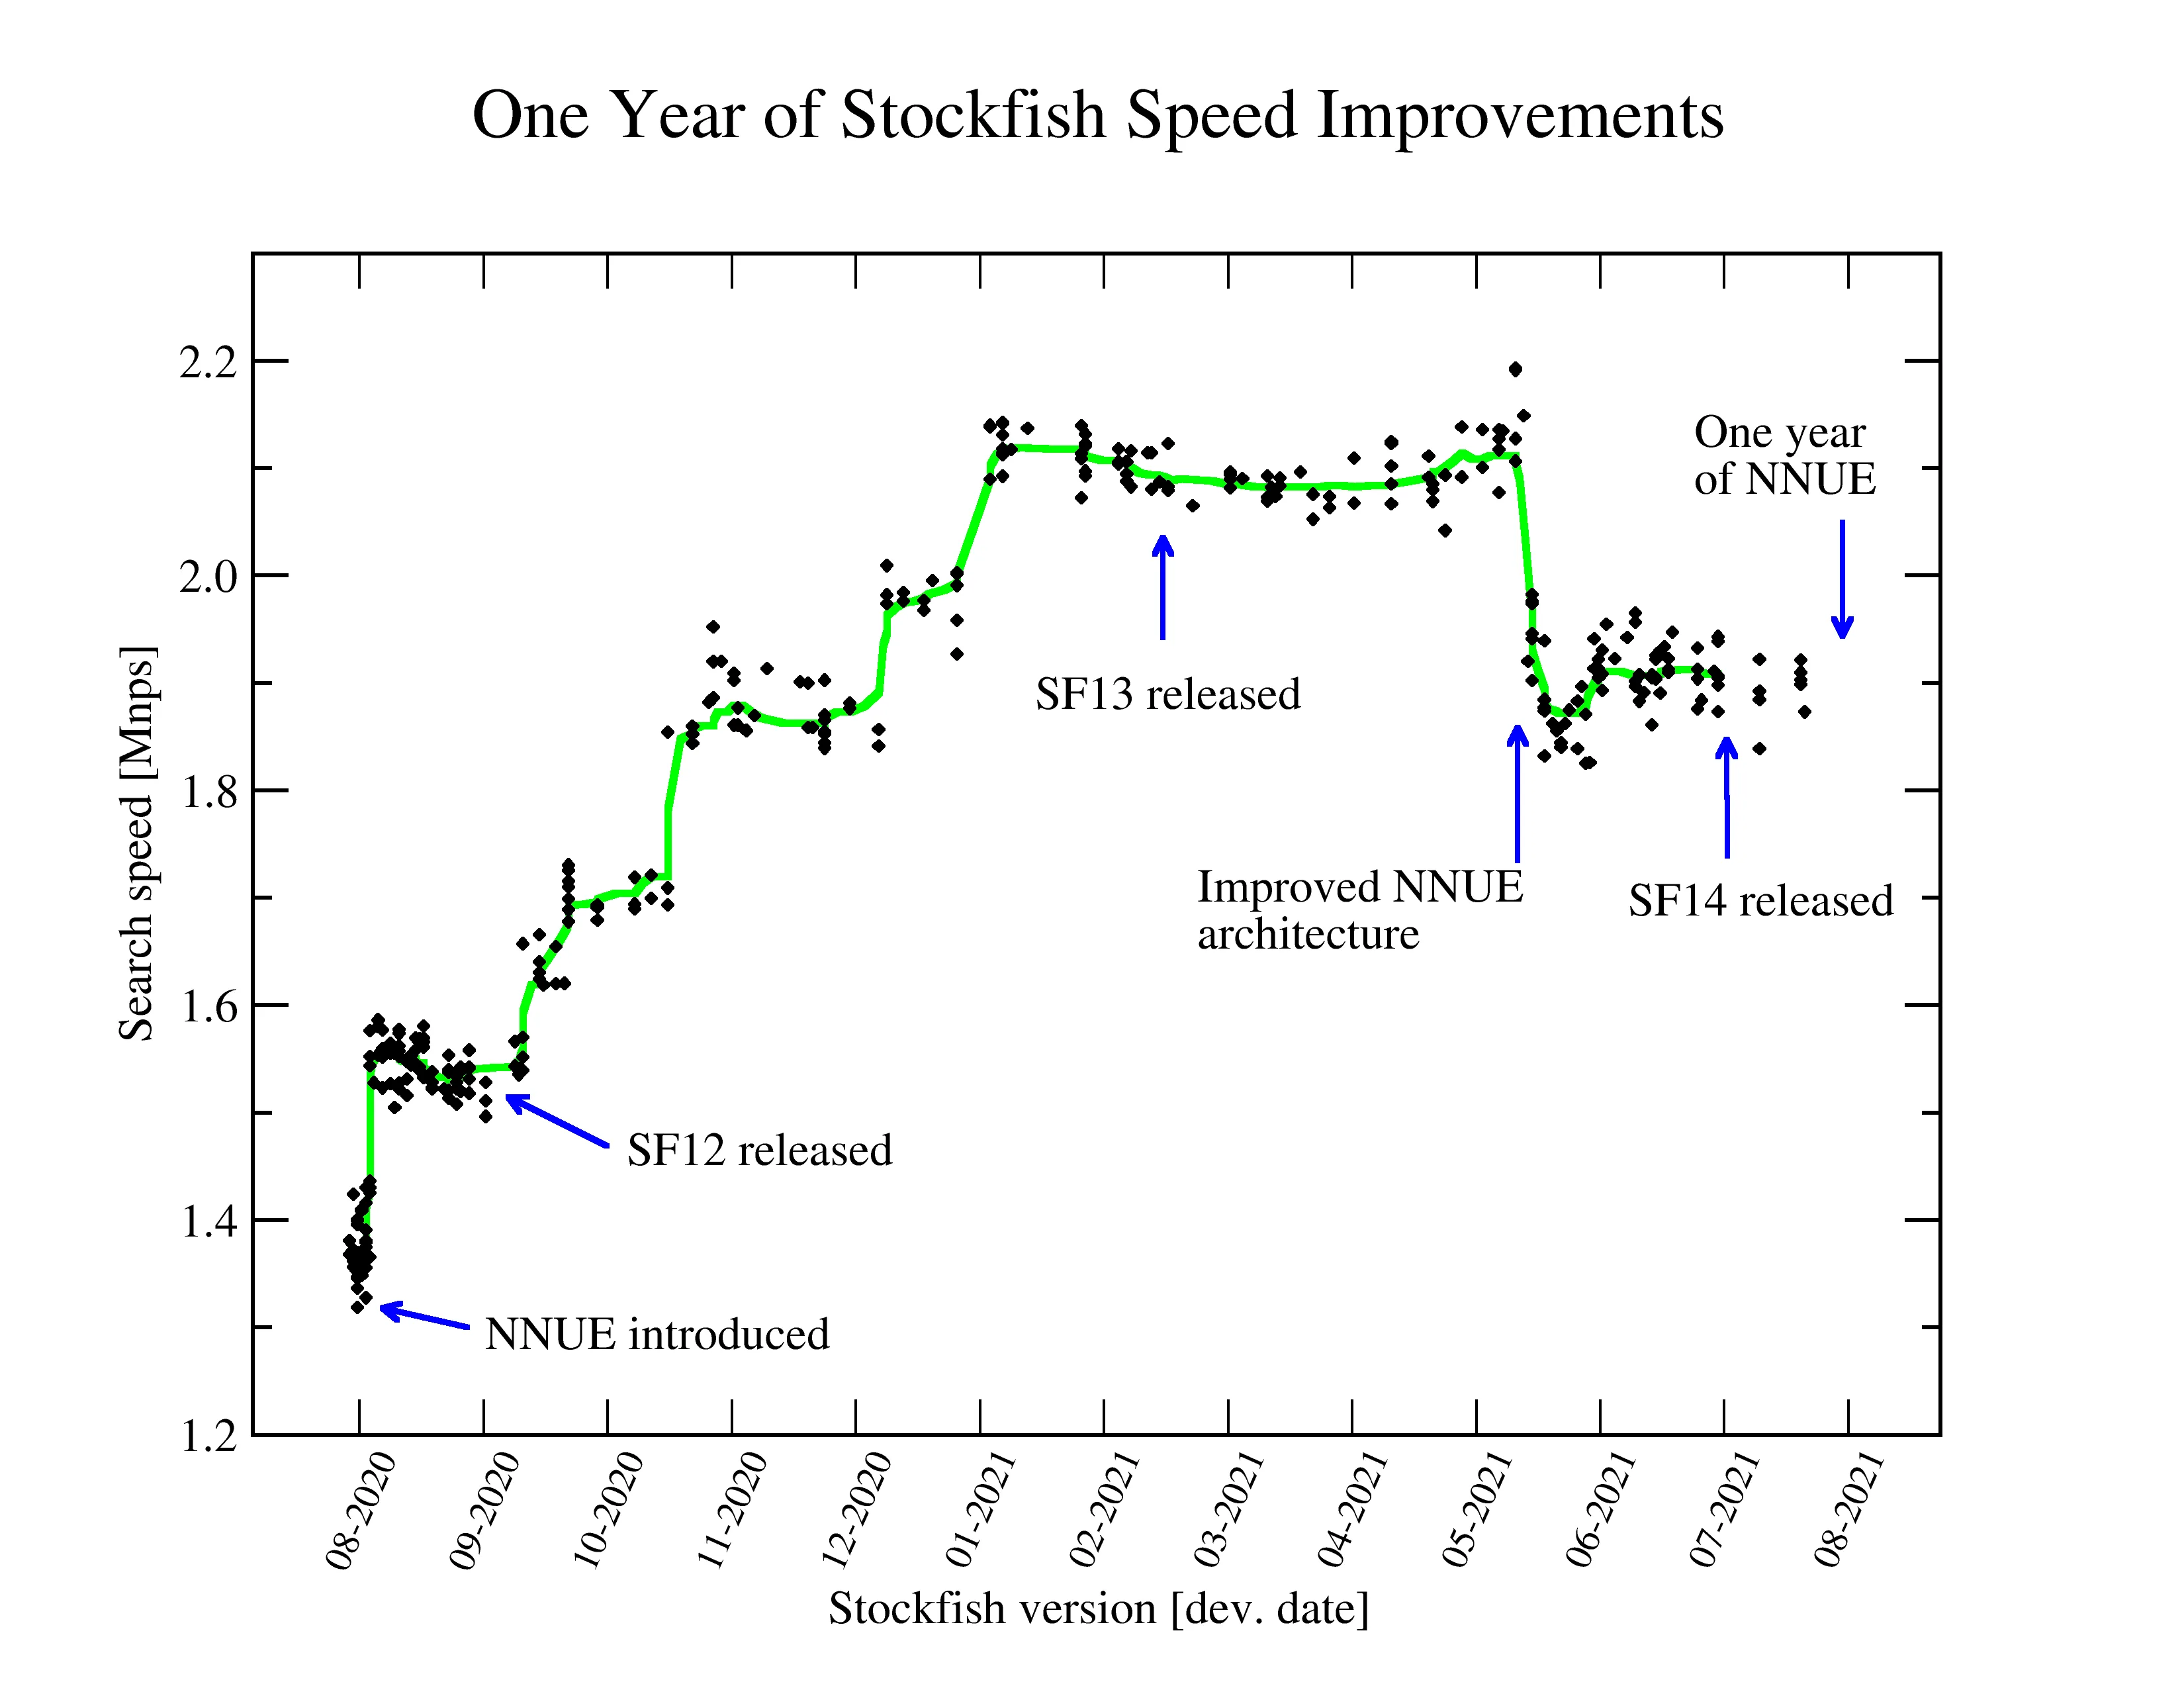
One year of NNUE speed improvements
Presents nodes per second (nps) measurements for all SF version between the first NNUE commit (SF_NNUE, Aug 2th 2020) and end of July 2021 on a AMD Ryzen 9 3950X compiled with make -j ARCH=x86-64-avx2 profile-build. The last nps reported for a depth 22 search from startpos using NNUE (best over about 20 measurements) is shown in the graph. For reference, the last classical evaluation (SF_classical, July 30 2020) has 2.30 Mnps.
The impact of efficient (incremental) updates (NNUE)
As measured with SF17dev (dev-20230824-4c4cb185), disabling the update_accumulator_incremental() functionality.
Speedup:
Result of  10 runs
==================
base (./stockfish.master       ) =    1287575  +/- 8703
test (./stockfish.patch        ) =     696064  +/- 3451
diff                             =    -591511  +/- 7318

speedup        = -0.4594
P(speedup > 0) =  0.0000

CPU: 16 x AMD Ryzen 9 3950X 16-Core Processor
Which corresponds to -67.55 ± 9.5 Elo on fishtest with the UHO book at LTC.
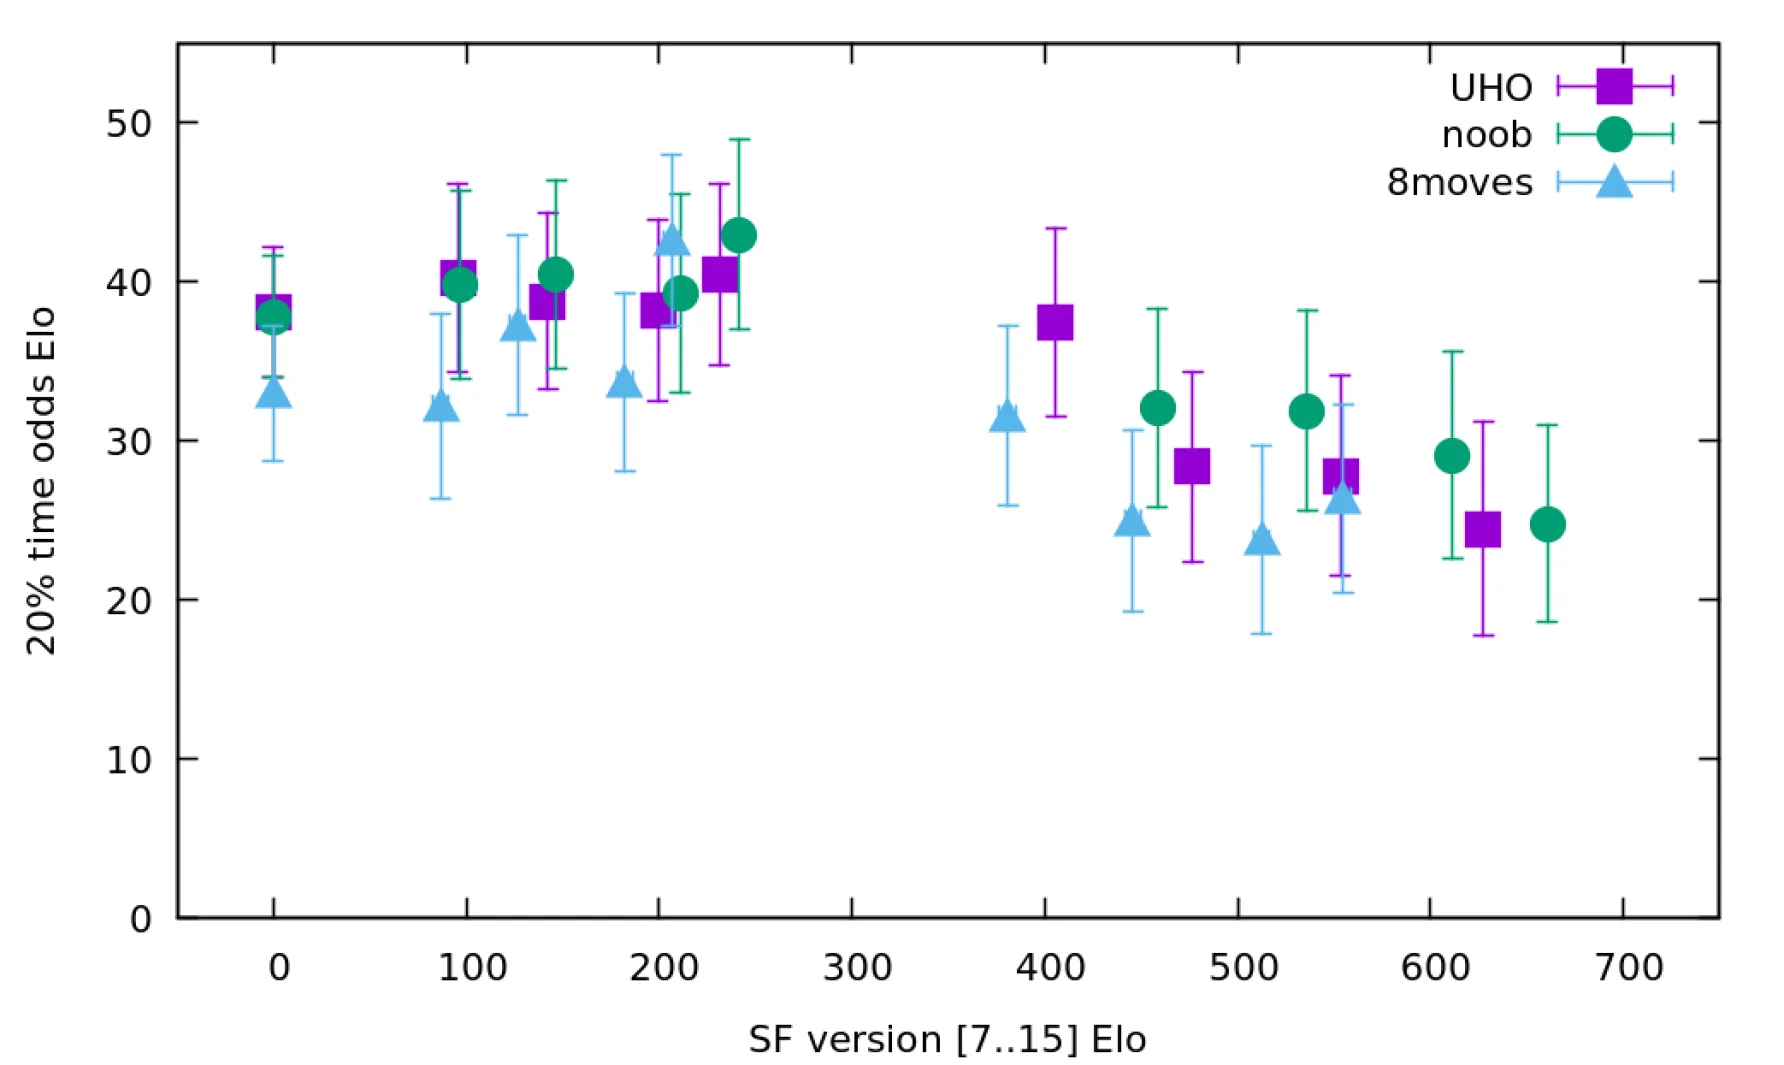
Round-robin tournament with SF releases, impact of book and time odds
Measured playing games of 5+0.05s, with SF 7 - 15, using the three different books. Each version plays once with the base TC, and once with 20% time odds.
Raw data for the above graph
UHO
| SF | Elo | 20%-odds | Elo-err | Odds-err |
|---|---|---|---|---|
| SF7 | 0.0 | 38.1 | 0.0 | 4.1 |
| SF8 | 95.8 | 40.3 | 4.2 | 5.9 |
| SF9 | 142.3 | 38.8 | 3.9 | 5.5 |
| SF10 | 199.5 | 38.2 | 4.0 | 5.7 |
| SF11 | 231.2 | 40.5 | 4.3 | 5.7 |
| SF12 | 405.6 | 37.5 | 4.0 | 5.9 |
| SF13 | 476.5 | 28.4 | 4.2 | 6.0 |
| SF14 | 553.4 | 27.8 | 4.5 | 6.3 |
| SF15 | 627.6 | 24.5 | 4.6 | 6.7 |
noob
| SF | Elo | 20%-odds | Elo-err | Odds-err |
|---|---|---|---|---|
| SF7 | 0.0 | 37.8 | 0.0 | 3.8 |
| SF8 | 97.2 | 39.8 | 4.3 | 5.9 |
| SF9 | 146.8 | 40.5 | 3.9 | 5.9 |
| SF10 | 211.1 | 39.3 | 4.3 | 6.2 |
| SF11 | 241.8 | 43.0 | 4.4 | 6.0 |
| SF12 | 458.4 | 32.1 | 4.3 | 6.2 |
| SF13 | 536.2 | 31.9 | 4.2 | 6.3 |
| SF14 | 611.3 | 29.1 | 4.5 | 6.5 |
| SF15 | 660.9 | 24.8 | 4.3 | 6.2 |
8moves
| SF | Elo | 20%-odds | Elo-err | Odds-err |
|---|---|---|---|---|
| SF7 | 0.0 | 33.0 | 0.0 | 4.2 |
| SF8 | 86.7 | 32.2 | 4.2 | 5.8 |
| SF9 | 126.7 | 37.3 | 4.0 | 5.6 |
| SF10 | 182.3 | 33.7 | 4.3 | 5.6 |
| SF11 | 206.5 | 42.6 | 4.0 | 5.4 |
| SF12 | 380.7 | 31.6 | 4.1 | 5.6 |
| SF13 | 445.8 | 25.0 | 4.0 | 5.7 |
| SF14 | 512.4 | 23.8 | 4.1 | 5.9 |
| SF15 | 554.5 | 26.4 | 4.1 | 5.9 |
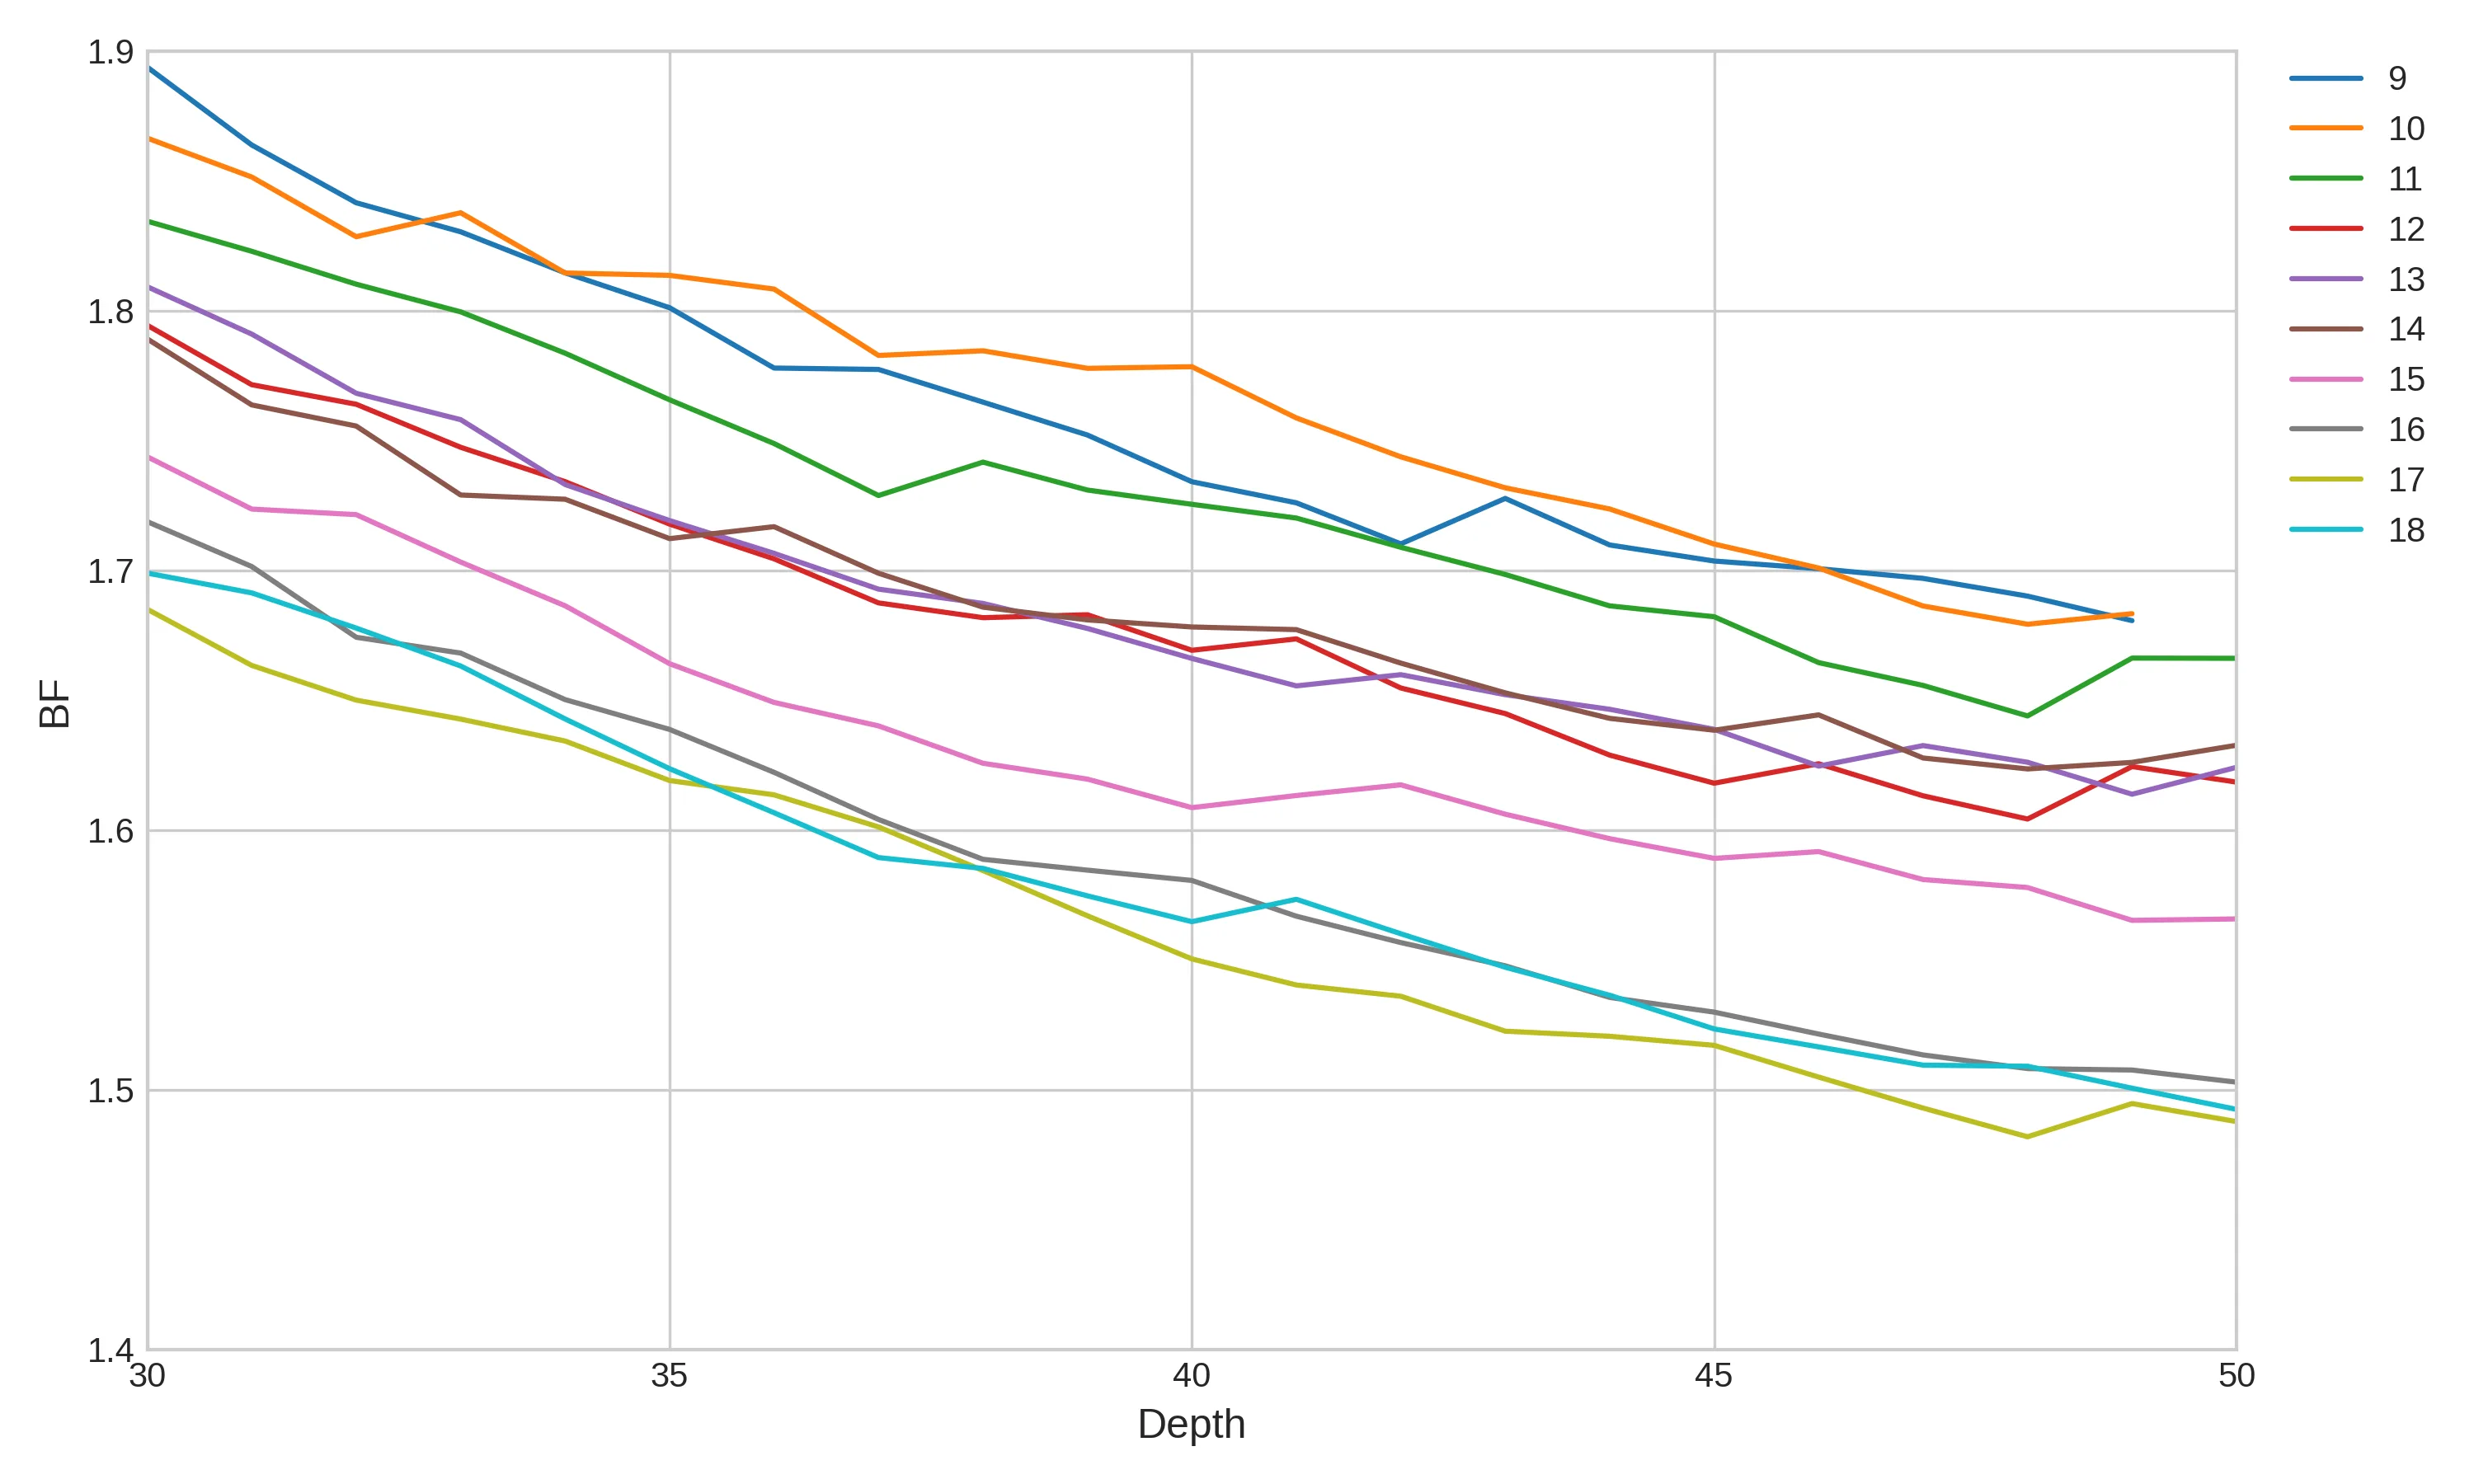
Branching factor of Stockfish
The branching factor ($B_f$) of Stockfish is defined such that $\text{nodes} = B_f^{\text{rootDepth}}$ or equivalently $B_f = \exp\left(\frac{\log(\text{nodes})}{\text{rootDepth}}\right)$. Here, this has been measured with a single search from the starting position.
The trend is the deeper one searches the lower the branching factor, and newer versions of SF have a lower branching factor. A small difference in branching factor leads to very large differences in number of nodes searched. For example, Stockfish 10 needs about 338x more nodes than Stockfish 17 to reach depth 49.
Raw data for the above graph
| Depth | SF_9 | SF_10 | SF_11 | SF_Classical | SF_12 | SF_13 | SF_14 | SF_14.1 | SF_15 | SF_15.1 | SF_16 | SF_16.1 | SF_17 | SF_17.1 | SF_18 |
|---|---|---|---|---|---|---|---|---|---|---|---|---|---|---|---|
| 1 | 20 | 20 | 20 | 20 | 20 | 20 | 20 | 20 | 20 | 20 | 20 | 20 | 20 | 20 | 20 |
| 2 | 47 | 54 | 54 | 56 | 42 | 42 | 48 | 51 | 45 | 66 | 40 | 44 | 48 | 45 | 48 |
| 3 | 152 | 136 | 147 | 150 | 153 | 84 | 181 | 154 | 191 | 120 | 70 | 69 | 76 | 72 | 103 |
| 4 | 495 | 247 | 574 | 479 | 303 | 241 | 630 | 807 | 264 | 144 | 101 | 92 | 97 | 512 | 258 |
| 5 | 1036 | 1157 | 782 | 989 | 532 | 572 | 741 | 1061 | 1449 | 174 | 131 | 123 | 124 | 609 | 541 |
| 6 | 2148 | 2250 | 2734 | 1161 | 1004 | 741 | 2448 | 1761 | 3954 | 1303 | 489 | 1815 | 197 | 752 | 900 |
| 7 | 3836 | 4481 | 5780 | 2808 | 1680 | 1169 | 3488 | 5459 | 6269 | 3126 | 1560 | 2096 | 309 | 2019 | 1546 |
| 8 | 6480 | 7849 | 9568 | 10224 | 4717 | 1849 | 5172 | 6998 | 11049 | 5791 | 2105 | 2565 | 1984 | 3436 | 3260 |
| 9 | 12958 | 11846 | 14134 | 15801 | 7299 | 3894 | 10602 | 12053 | 15347 | 8541 | 4500 | 5901 | 3415 | 4748 | 3703 |
| 10 | 27933 | 27338 | 18613 | 25231 | 15571 | 10144 | 23676 | 28785 | 23259 | 20978 | 7548 | 7103 | 3634 | 8620 | 4835 |
| 11 | 89387 | 61978 | 37332 | 36205 | 32300 | 29662 | 44751 | 34551 | 40064 | 29040 | 13058 | 22753 | 8402 | 15172 | 32898 |
| 12 | 161734 | 80917 | 99541 | 98957 | 79712 | 57232 | 60151 | 103152 | 57767 | 41207 | 35836 | 27955 | 11157 | 34187 | 41065 |
| 13 | 257254 | 160903 | 161123 | 159227 | 97905 | 89986 | 99443 | 166195 | 97551 | 60308 | 59384 | 31553 | 14979 | 37544 | 52822 |
| 14 | 292516 | 263420 | 235857 | 188774 | 135890 | 114602 | 140890 | 226798 | 152736 | 97789 | 73942 | 47991 | 47967 | 50495 | 57960 |
| 15 | 619466 | 474032 | 525778 | 372631 | 239380 | 263818 | 206290 | 296769 | 214622 | 142447 | 173344 | 90454 | 82930 | 64450 | 61564 |
| 16 | 1019034 | 680143 | 654750 | 405644 | 420597 | 319442 | 327876 | 460525 | 484091 | 199887 | 302305 | 130482 | 117953 | 80751 | 108990 |
| 17 | 1273498 | 1065531 | 1154718 | 497031 | 502334 | 539694 | 700175 | 620141 | 570807 | 268004 | 358119 | 279903 | 130041 | 100673 | 113959 |
| 18 | 2090089 | 1736290 | 1333553 | 602794 | 888362 | 605175 | 1254757 | 674532 | 873460 | 298071 | 406239 | 378645 | 278301 | 242639 | 177777 |
| 19 | 3889524 | 2883012 | 2466048 | 1697325 | 1163966 | 849949 | 1461089 | 1086024 | 1119774 | 332202 | 517102 | 492584 | 479846 | 294310 | 566379 |
| 20 | 6651739 | 4186926 | 3442296 | 2223954 | 2233676 | 1504284 | 2142551 | 1731345 | 1494341 | 557706 | 768773 | 898610 | 631058 | 356864 | 782174 |
| 21 | 8289557 | 4805680 | 5139240 | 2921191 | 2445813 | 3168396 | 2296200 | 2217575 | 2170638 | 753633 | 872083 | 1176108 | 698143 | 693162 | 1241950 |
| 22 | 10859418 | 6827891 | 6158594 | 4887298 | 3007878 | 3898518 | 3992124 | 2939401 | 2709915 | 1197489 | 1356583 | 1504022 | 942656 | 753875 | 1286543 |
| 23 | 15123810 | 11731363 | 9742620 | 5254745 | 4135648 | 5354837 | 5163931 | 7071762 | 3144247 | 1586189 | 2240135 | 2486833 | 1239406 | 901681 | 1399975 |
| 24 | 20808306 | 17783159 | 12170495 | 5804128 | 5840781 | 6300391 | 8203572 | 9001254 | 5196382 | 2305729 | 3180221 | 2849481 | 2442109 | 1179519 | 2055087 |
| 25 | 29432182 | 25759382 | 16577641 | 9887365 | 8616999 | 9226135 | 9663515 | 9575262 | 7230340 | 3251912 | 3441646 | 3582655 | 2851004 | 2042808 | 2970873 |
| 26 | 38405658 | 37355659 | 29415435 | 15416329 | 12367860 | 13291389 | 13132115 | 12540800 | 10155997 | 3545947 | 5785705 | 5160652 | 3777377 | 2915802 | 3995172 |
| 27 | 61348538 | 65193345 | 35334801 | 16892508 | 14200465 | 17614230 | 17260982 | 14253616 | 11757619 | 3840811 | 7477520 | 6713587 | 4182386 | 4365029 | 4359026 |
| 28 | 91156568 | 84966056 | 52360545 | 22446945 | 20151711 | 22949203 | 23305850 | 17086667 | 14952204 | 4248920 | 7825201 | 7315094 | 4579410 | 4505986 | 5356876 |
| 29 | 152014843 | 113526990 | 56749397 | 31024928 | 24336215 | 27545670 | 32590861 | 24537585 | 16522922 | 6665787 | 9338607 | 8935544 | 5542564 | 4841166 | 5502629 |
| 30 | 208471933 | 134803005 | 80264413 | 40636168 | 41377827 | 52979471 | 37897422 | 29100645 | 17532106 | 9416686 | 11373475 | 12808942 | 6276969 | 6090037 | 8033656 |
| 31 | 240772842 | 196015388 | 120969918 | 43679803 | 49872575 | 70001618 | 43511005 | 39989064 | 21326309 | 12481255 | 14291027 | 16399268 | 7084546 | 6583727 | 11870263 |
| 32 | 305614124 | 243327159 | 176419860 | 60779582 | 77092786 | 83237024 | 66185509 | 58476165 | 35327951 | 13176152 | 14508031 | 19160671 | 9105481 | 8718066 | 15523722 |
| 33 | 460341298 | 525261279 | 262818230 | 104196553 | 99594493 | 121678252 | 70265337 | 74720366 | 42781773 | 29047503 | 21536616 | 28320792 | 12975039 | 8882232 | 19520018 |
| 34 | 627444498 | 626723336 | 349662654 | 147117787 | 134411590 | 131502991 | 117669613 | 89119274 | 51973369 | 33777300 | 24887993 | 31733455 | 17887048 | 12279026 | 21341006 |
| 35 | 877803214 | 1117294961 | 437775571 | 244005733 | 167315794 | 172011884 | 149278426 | 110476836 | 55002290 | 39953796 | 32167747 | 36703106 | 21077663 | 13673813 | 23256923 |
| 36 | 990773530 | 1824606196 | 547475749 | 296743922 | 216932118 | 226846508 | 281527921 | 161111544 | 66188561 | 52697231 | 36605915 | 45026834 | 30184087 | 15440239 | 25878691 |
| 37 | 1741868476 | 1948381278 | 625189048 | 309340804 | 255329101 | 286768418 | 327695873 | 324326807 | 89076357 | 63613297 | 39166657 | 48749981 | 36650844 | 16953238 | 27868600 |
| 38 | 2363551706 | 3608706372 | 1432246160 | 358255505 | 378948934 | 428910293 | 415235309 | 419954003 | 104499345 | 81300722 | 43595727 | 57954972 | 39310411 | 18760781 | 40078051 |
| 39 | 3148966217 | 5554166307 | 1959631791 | 418553825 | 654266100 | 578750849 | 624817445 | 485331551 | 146707304 | 109373862 | 62509514 | 80617677 | 40464757 | 31534030 | 48962825 |
| 40 | 3652327064 | 10014646570 | 2986844761 | 647206461 | 794186607 | 736676898 | 984219044 | 627202823 | 181038342 | 120243575 | 89602927 | 105004273 | 41399955 | 38626444 | 59844966 |
| 41 | 5224502250 | 11274140350 | 4543685536 | 802616934 | 1476486355 | 945454647 | 1610720260 | 702641311 | 327908422 | 127205662 | 98940749 | 145615463 | 49181743 | 41710464 | 117289183 |
| 42 | 6127078317 | 13841000586 | 5932293513 | 836227440 | 1533085761 | 1746304445 | 1953800834 | 1052213918 | 588646348 | 138853511 | 117973493 | 180607180 | 67316394 | 48578868 | 129289657 |
| 43 | 16232620003 | 17967835068 | 7783862835 | 896362311 | 1962927879 | 2372473217 | 2416294925 | 1204729923 | 704287921 | 187144599 | 143353641 | 190606039 | 70823411 | 65829957 | 141157943 |
| 44 | 17718877503 | 25273820455 | 9652527844 | 1952302791 | 2099616405 | 3372924274 | 3072158370 | 1970670881 | 872977208 | 233082949 | 156729107 | 227657402 | 101871246 | 91721103 | 160543741 |
| 45 | 25741622196 | 30584201846 | 14557217345 | 2862286068 | 2534362233 | 4495023334 | 4453379221 | 2145570435 | 1125148935 | 286366031 | 203808982 | 286695307 | 139675067 | 113349617 | 168424694 |
| 46 | 40499236349 | 40789584966 | 15067833369 | 3334440078 | 5072562082 | 4943259313 | 8612561011 | 3902062051 | 1928316855 | 357211612 | 241777135 | 443906150 | 146118621 | 132959880 | 208166005 |
| 47 | 62111873752 | 46215215573 | 19558181065 | 9230842551 | 5760986205 | 10088353213 | 8788037210 | 7455854537 | 2230430028 | 479309517 | 286733914 | 524498432 | 151232944 | 174172903 | 253733303 |
| 48 | 86847634536 | 63800375952 | 23005194627 | 10641223658 | 7116913776 | 13627712965 | 12633107125 | 8190890802 | 3212535920 | 658225438 | 367143915 | 641079230 | 158042099 | 236563617 | 377756655 |
| 49 | 111558931172 | 120597835455 | 73124504606 | 23520860602 | 21079212074 | 15273984174 | 22132085123 | 9179551077 | 3418110578 | 839590469 | 543884199 | 887068496 | 356737000 | 379142240 | 433180915 |
| 50 | 121532848050 | 28477080465 | 33936548877 | 44066435831 | 11975030336 | 5444154366 | 1093863142 | 701965402 | 1119335316 | 422735554 | 425769633 | 494944083 |
Contempt measurements
Older SF (around SF10) had contempt that worked rather well. This data shows the dependence of Elo difference between SFdev of October 2018 and older versions of Stockfish depending on contempt value (The SFdev used is approx. 40Elo above SF9). Upper and lower bounds represent value with maximum error.
| Opponent | STC | LTC |
|---|---|---|
| 7 |  |  |
| 8 |  |  |
| 9 |  |  |
Full data with values https://docs.google.com/spreadsheets/d/1R_eopD8_ujlBbt_Q0ygZMvuMsP1sc4UyO3Md4qL1z5M/edit#gid=1878521689
Elo change with respect to TC
Here is the result of some scaling tests with the 2moves book. 40000 games each (STC=10+0.1, LTC=60+0.6)
| SF7 -> SF8 | SF8 -> SF9 | SF9 -> SF10 | |
|---|---|---|---|
| Elo STC | 95.91 +-2.3 | 58.28 +-2.3 | 71.03 +-2.4 |
| Elo LTC | 100.40 +-2.1 | 68.55 +-2.1 | 65.55 +-2.2 |
So we see that the common wisdom that increased TC causes elo compression is not always true.
See https://github.com/official-stockfish/Stockfish/issues/1859#issuecomment-449624976
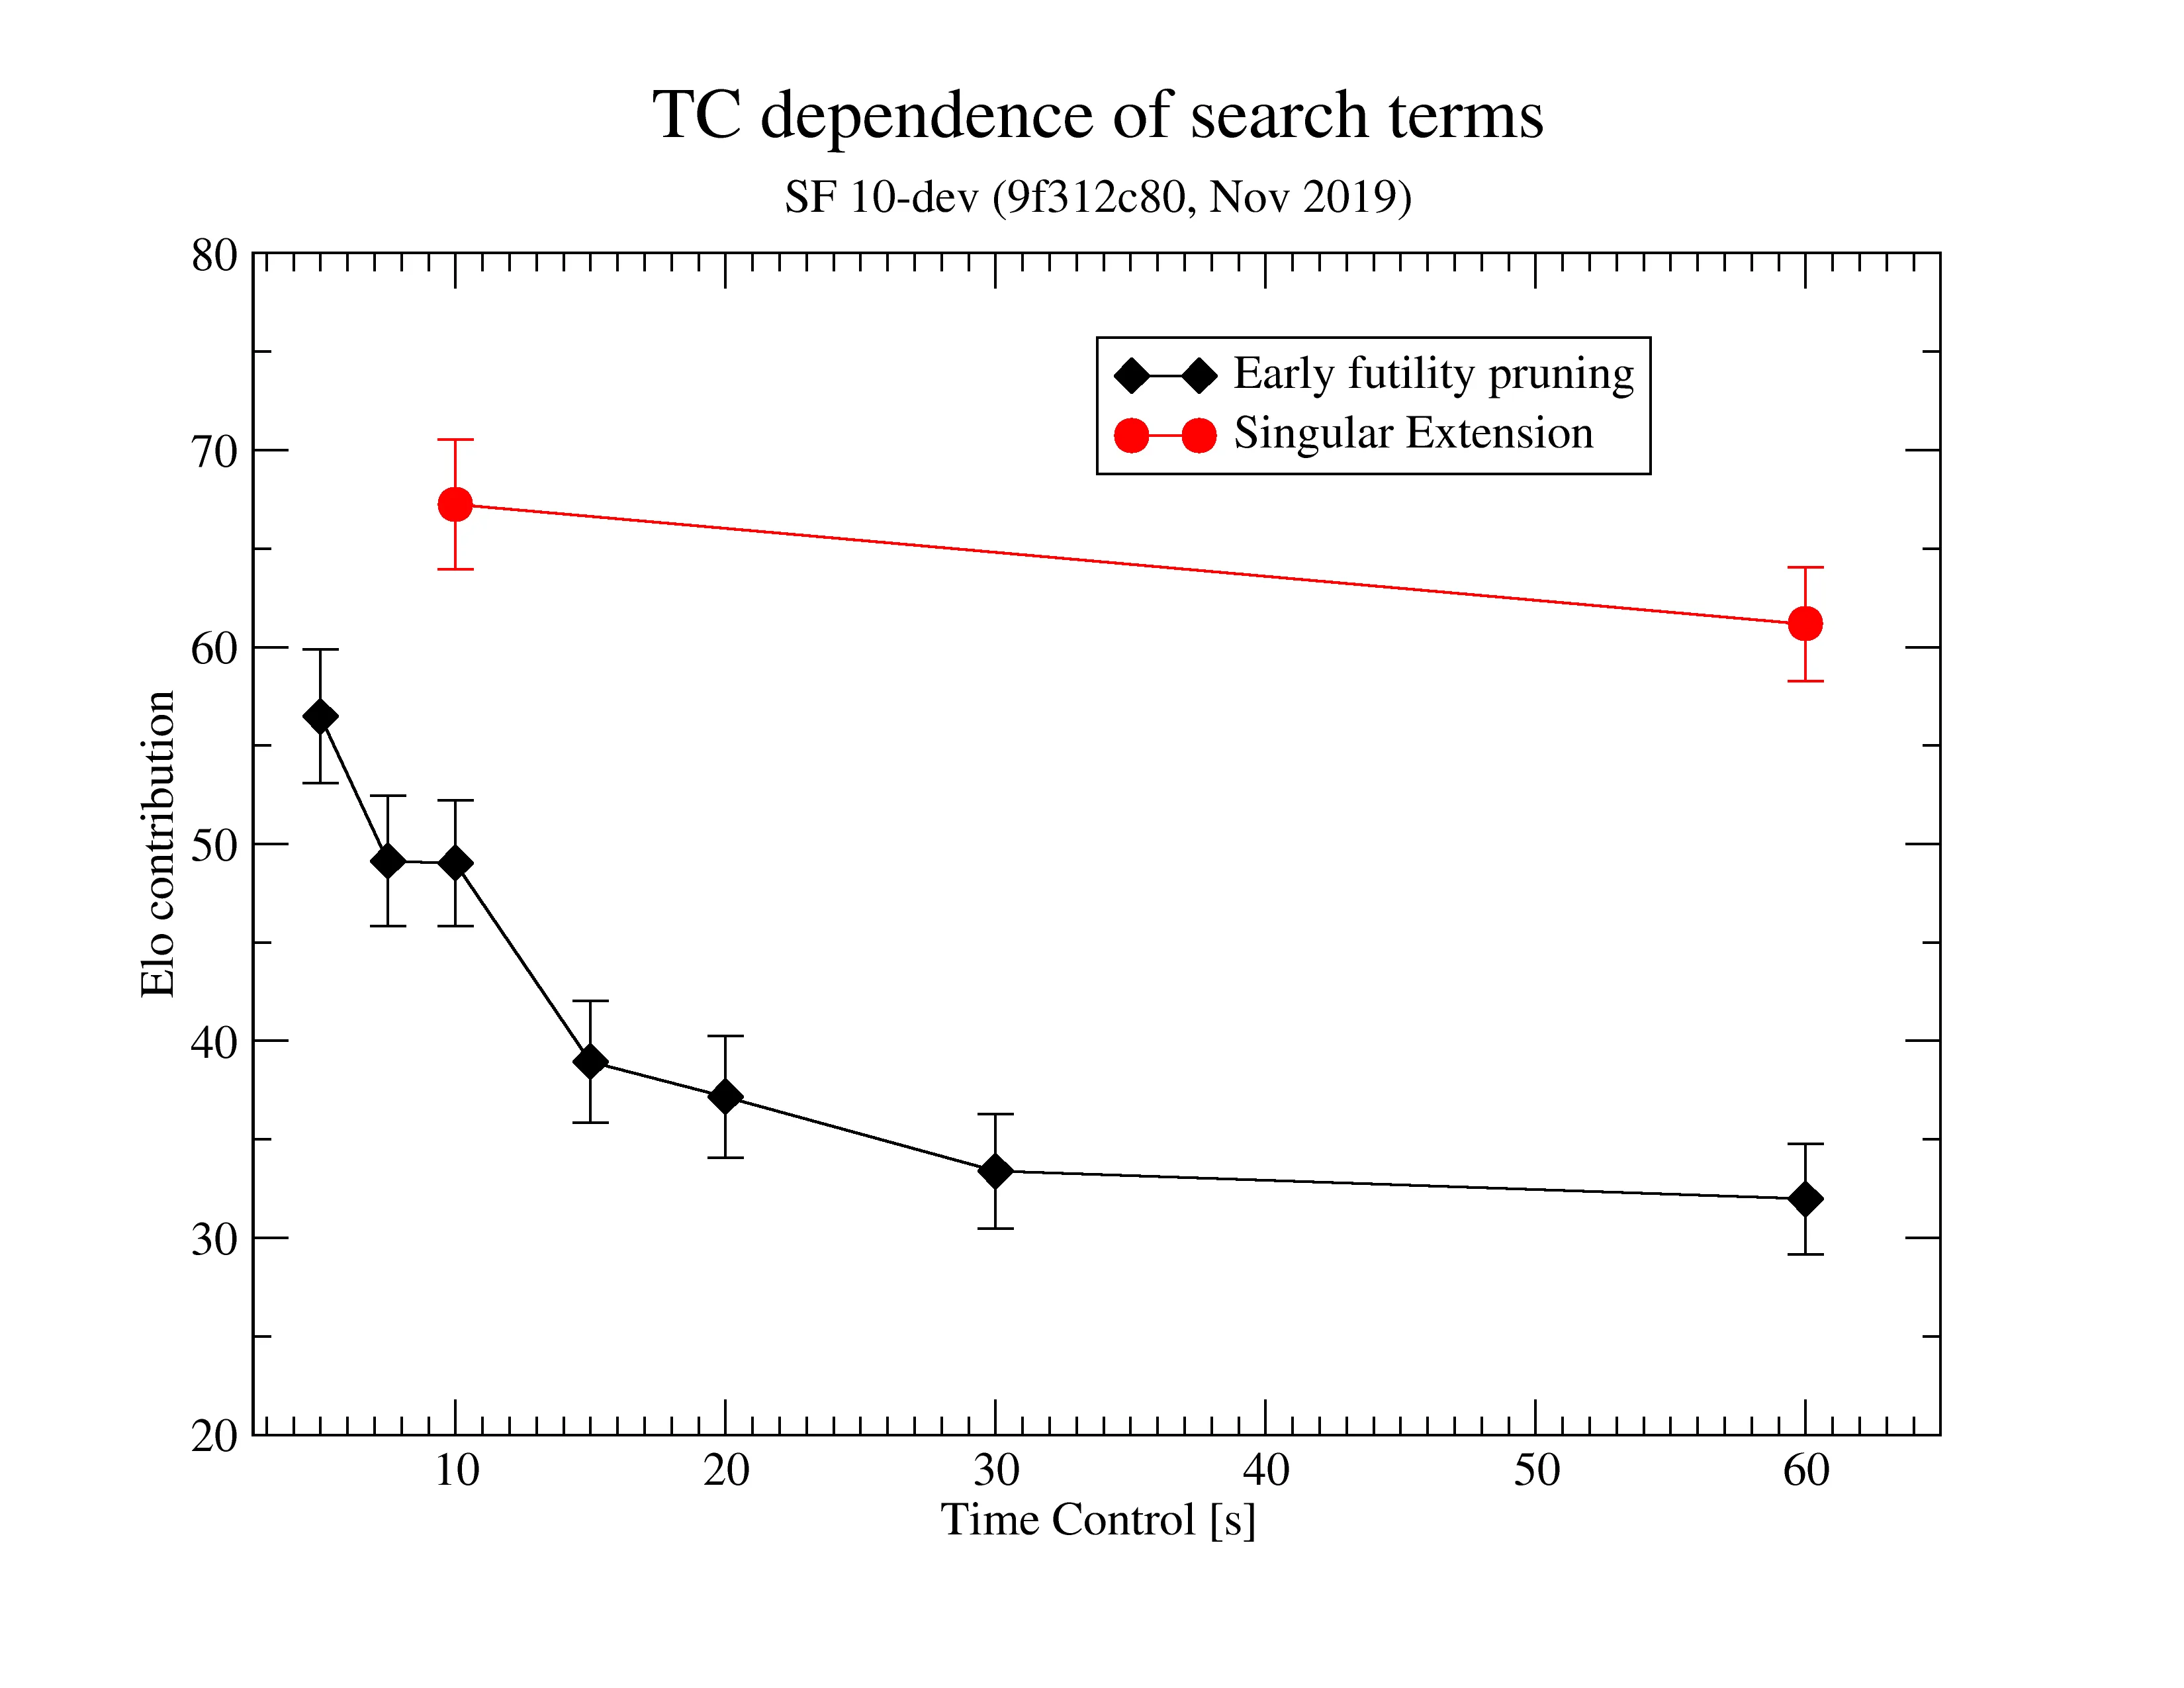
TC dependence of certain terms in search
Discussed here https://github.com/official-stockfish/Stockfish/pull/2401#issuecomment-552768526
Elo contributions from various evaluation terms
See spreadsheet at: https://github.com/official-stockfish/Stockfish/files/3828738/Stockfish.Feature.s.Estimated.Elo.worth.1.xlsx
Note: The estimated elo worth for various features might be outdated, or might get outdated soon.